Over the course of only four months, the crude oil price experienced one of the most violent and consequential cycles ever in the history of global energy markets. What started as simmering political tension in the Middle East escalated into a full-blown supply crisis that would affect inflation expectations, future central bank monetary policy, global trade flows, and the day-to-day cost of living for billions of people. From the February 28, 2026 U.S.-Israeli strikes on Iranian energy and nuclear infrastructure to the historic peace memorandum moving toward a formal signing in Switzerland, the world has been held hostage to a crisis that only has now come to light and that will have consequences for years to come.
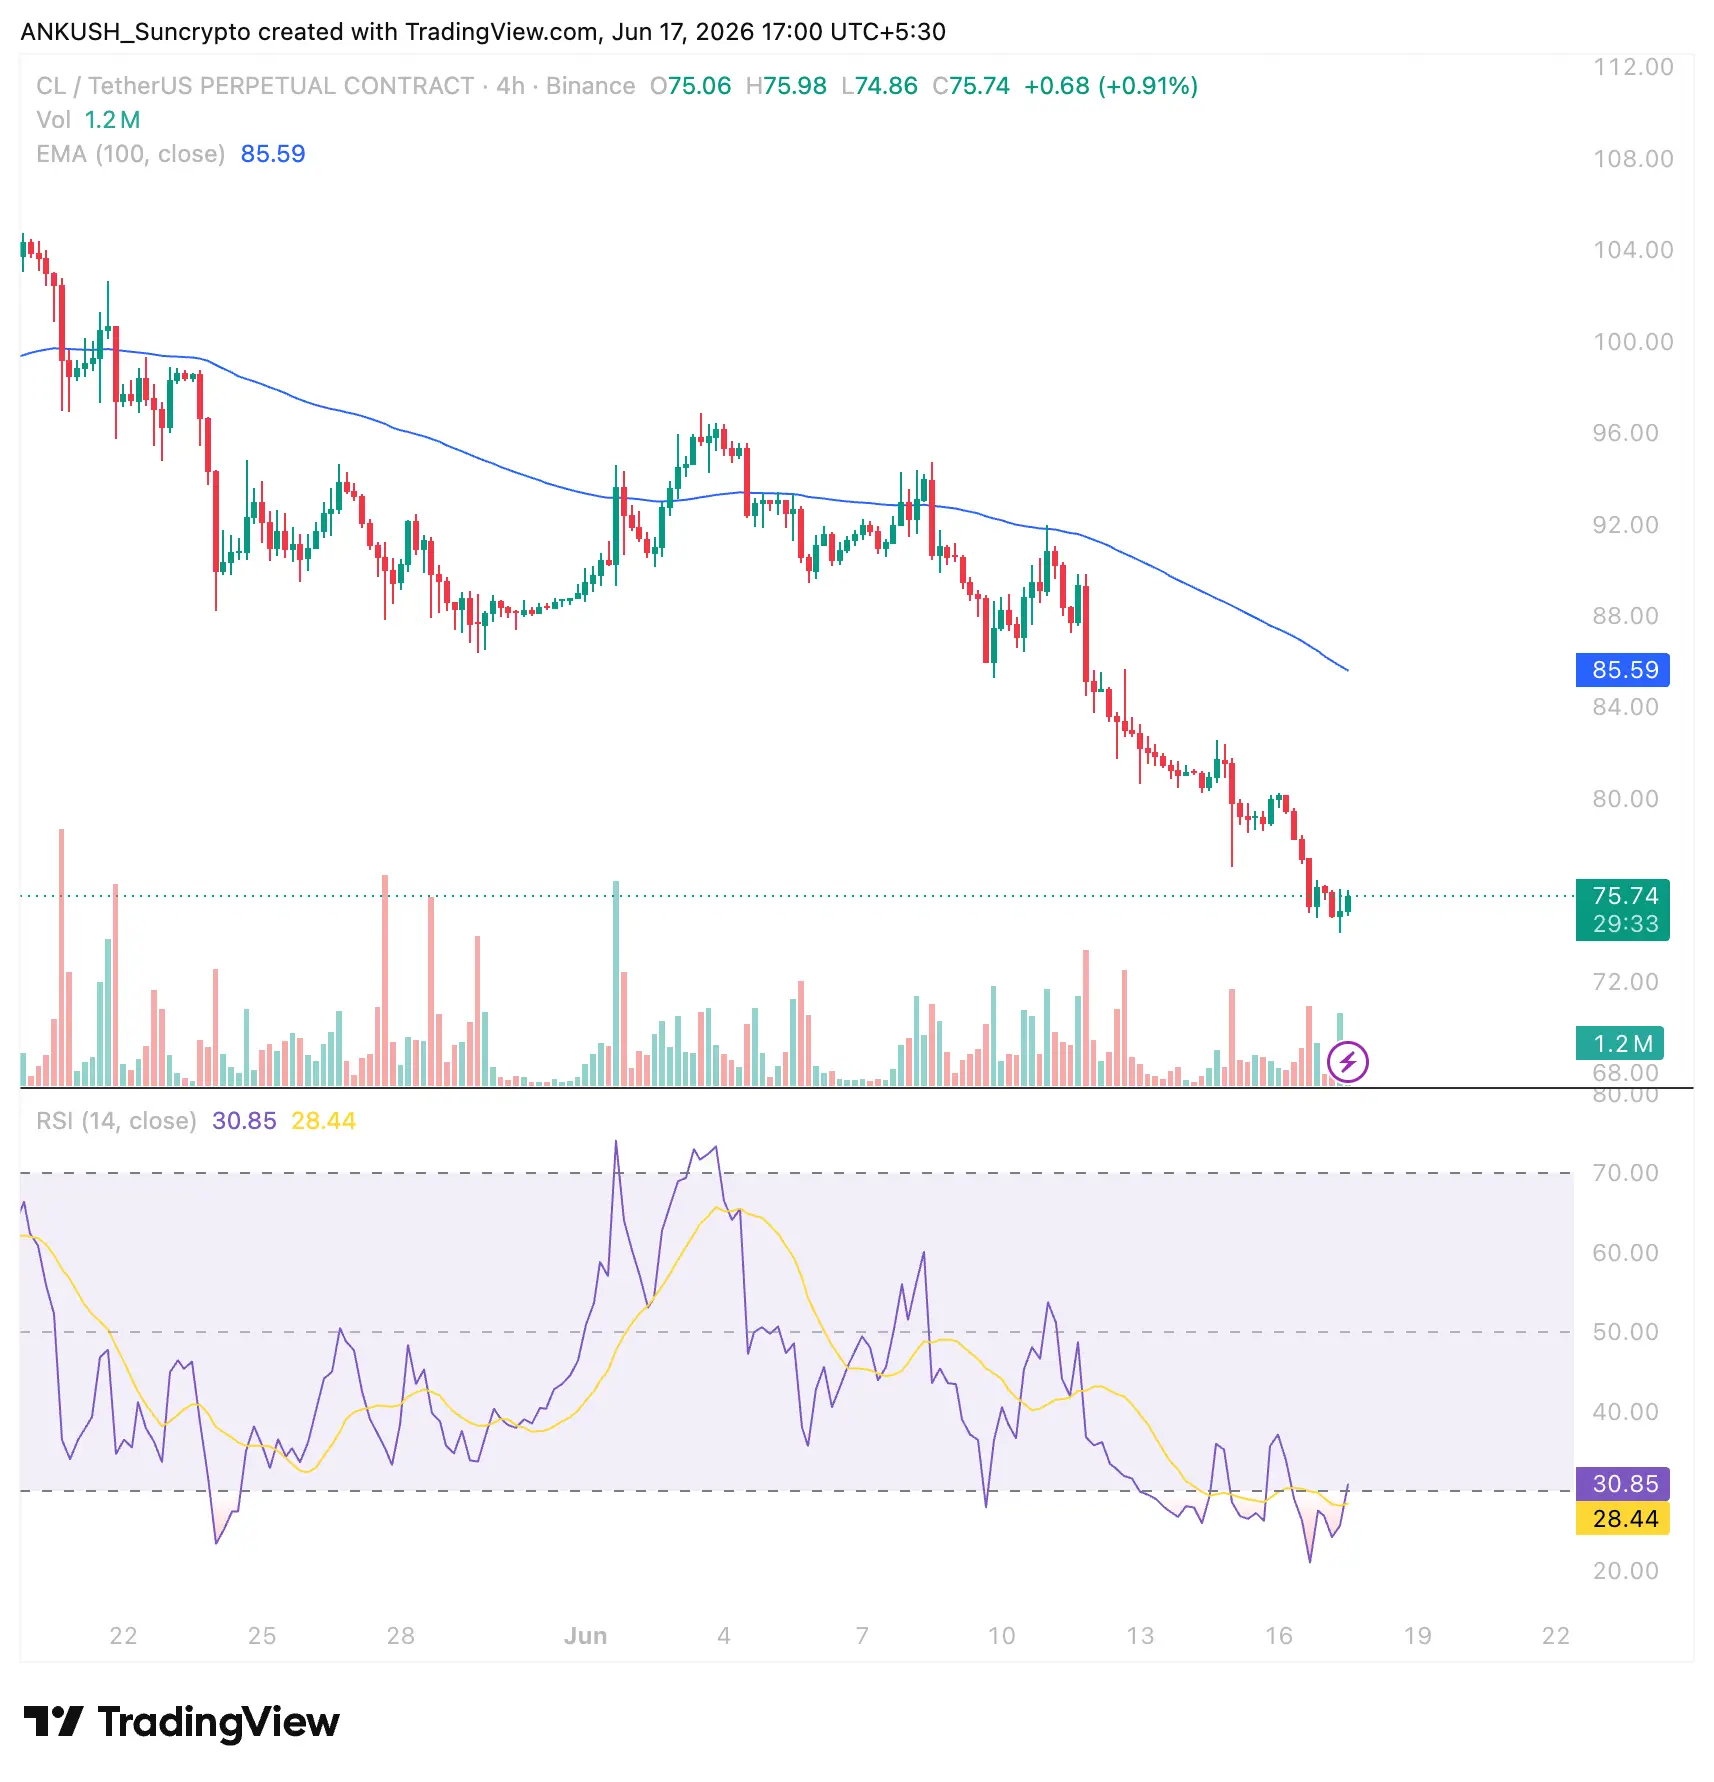
After briefly peaking at above $115 per barrel, WTI crude oil price has now tumbled to $76–$78 per barrel and Brent crude oil to $78–$80 per barrel, crude prices have plunged steeply for a fourth straight session since a U.S.-Iran memorandum of understanding was announced. Yet despite this dramatic decline, prices remain nearly 20% above pre-war levels; a testament to how much structural damage has been done to global supply chains, inventories, and energy infrastructure across the Gulf region.
This article provides a deep dive into the crude oil price crisis of 2026, how it started, how it worsened, what were the key market events that made the difference, the expert consensus on what’s driving prices now, and the range of scenarios that could determine where oil, and the broader global economy, heads from here.
What triggered the 2026 Crude Oil price crisis?
The roots of the 2026 energy shock lie in a geopolitical confrontation that markets had long feared but never fully priced in. On the night of February 28, 2026, coordinated U.S. and Israeli military operations targeted Iranian energy infrastructure, nuclear enrichment facilities, and strategic military sites. The response was immediate and market-shaking: the crude oil price began rising within hours of the strikes, with traders around the world recalibrating risk models that had never anticipated a Strait of Hormuz closure of this magnitude.
The International Energy Agency issued an extraordinary statement within days of the strikes, likening the disruption to both 1970s oil shocks occurring simultaneously. The analogy was apt: not since the Arab Oil Embargo of 1973 and the Iranian Revolution of 1979 had the global oil market faced a simultaneous supply and transit threat of this scale. The IEA’s May 2026 Oil Market Report later confirmed that more than 14 million barrels per day of supply had been effectively shut in since hostilities began, a figure that dwarfs any previous single-event supply disruption in modern history.
Iran’s response to the strikes was swift and consequential: it announced the effective closure of the Strait of Hormuz to commercial shipping, invoking its longstanding threat to weaponize this narrow but indispensable waterway. Through that 34-mile chokepoint transits roughly 20% of the world’s daily oil supply, crude from Saudi Arabia, Iraq, Kuwait, the UAE, and Qatar, along with significant volumes of liquefied natural gas. With the strait functionally shut, the global oil market lost access to supply from countries collectively responsible for nearly one-third of all oil production on Earth.
How did Crude Oil price live markets react phase by phase?
The oil market’s response to the crude oil price crisis unfolded in distinct phases, each marked by escalating military action, diplomatic false starts, and extraordinary price volatility. Understanding these phases is essential to grasping why the crude oil price moved so dramatically and what structural damage was done along the way.
Phase 1: The Initial Shock , February to Early March 2026
In the two weeks following the initial strikes, Brent crude surged from approximately $72–$75 per barrel to above $91 per barrel; a gain of more than 25% in a fortnight. WTI rose from about $70 a barrel to above $88. The International Energy Agency ( IEA) announced that it was releasing the largest-ever coordinated emergency reserve release, with its member countries releasing 400 million barrels from strategic reserves to try to stabilize markets. Japan, South Korea and the EU all used strategic reserves at the same time.
Yet, despite these moves, prices continued to hit a peak before dropping again. The Strait of Hormuz was effectively closed to tanker traffic and insurance markets began pricing war-risk premiums that made many shipping routes commercially unviable
Phase 2: Escalation and Peak , Mid-March to May 2026
The crisis reached a new level of severity on March 23, when Trump issued a public 48-hour ultimatum to Tehran, threatening to blow up Iranian power plants and bridges unless the Strait was reopened. The Brent crude oil price rose above $113 per barrel, while WTI broke $100 for the first time since 2022 and moved toward $115. According to the U.S. Energy Information Administration’s most recent June Short-Term Energy Outlook, the April average price for Brent crude was $117 per barrel , the highest monthly average in more than a decade.
The most recent U.S. strikes in southern Iran, on May 26, brought WTI back to $93.89 and Brent to $99.58, after the earlier diplomatic lull caused some price retracement. The Brent crude oil price averaged $107 per barrel for the month of May , quite high yet, but the first monthly decline since December 2025, as analysts and investors cautiously proceeded to bet on the early-stage U.S.-Iran backchannel negotiations being conducted through Pakistan.
Phase 3: Diplomatic De-escalation , June 2026
On June 11, 2026, Trump announced that the U.S. had reached a ‘great settlement’ with Iran , but the deal was ‘still subject to finalization of documents,’ which left the markets in huge suspense. On June 11 WTI fell 6% to sit around $86.51, and Brent fell 5% to sit around $89.15.
The following week brought a cascade of further declines: on June 14, both benchmarks dropped close to 9%, with WTI around $77 and Brent near $79 per barrel — their lowest levels since early March. Brent shares fell 5% to wrap up 4 days of losses on June 17, 2026. As of June 16–17, 2026, with a formal MOU signing expected in Switzerland on June 19, WTI has fallen further to approximately $76–$78 per barrel, and Brent trades around $78–$80, extending its fifth consecutive session of losses. EIA analysis
| Event | Date | WTI Price | Brent Price | Move |
| Pre-war baseline | Late Feb 2026 | $70 | $61 – $72 | — |
| U.S.-Israel strikes begin | Feb 28, 2026 | $72 | $75 | Rally begins |
| Iran closes Strait of Hormuz | March 2026 | $88–$100 | $91–$105 | +30% surge |
| Trump 48-hr ultimatum | March 23, 2026 | $100–$115 | $113+ | Near peak |
| May Brent average (EIA) | May 2026 | $105 | $107 avg | First decline |
| Trump peace signal | June 11, 2026 | $86.51 | $89.15 | -4% fall |
| Peace deal announcement | June 14–15, 2026 | $77–$80 | $79–$83 | -9% drop |
| As of June 17, 2026 | June 17, 2026 | $76–$78 | $78–$80 | 4-day losing streak |
Impact of Strait of Hormuz closure on Crude Oil Price
Most people would be surprised to learn that the Strait of Hormuz is more than a waterway. Much of the world’s energy supply depends on the function and control of this narrow maritime corridor. At its narrowest, the strait is only 34 miles wide, with only two navigable shipping channels of roughly two miles each. Through this bottleneck passes approximately 20 million barrels of oil per day , nearly one-fifth of global consumption , along with massive volumes of liquefied natural gas destined for Europe and Asia.
The effective closure of the strait additionally disrupted exports not just from Iran itself, but from Saudi Arabia, Iraq, Kuwait, Qatar, and the UAE , countries that collectively account for nearly a third of global oil output. But yes, there are alternatives to the Hormuz route as well, including use of the East-West Pipeline operated by Saudi Arabia to the Red Sea, the Habshan-Fujairah pipeline operated by Abu Dhabi to the Gulf of Oman , and shipment on barge to the Strait of Malacca and onward to East and Southeast Asia . However, these alternatives have a combined capacity of roughly 6–7 million barrels per day, a fraction of the 20 million barrels that normally transit Hormuz daily.
The global-stock consequences were severe. OECD commercial oil stocks, which the markets depend on as a cushion against supply disruptions, started being drawn down at historically fast rates. The U.S. Strategic Petroleum Reserve was liquidated for the most part, dipping to its lowest level in 43 years (since 1983), which severely constrained the government’s ability to deploy government assets for emergency relief. Asian refineries, especially in China, India, South Korea, and Japan, were starved dry as their Gulf supply lanes disappeared and they had to purchase even more crude, at steep risk premiums, in the Atlantic Basin.
How did Crude Oil price shock transmit into the broader economy?
The macro-economic fallout for prolonged triple-digit oil prices spanned many areas. The crude oil price acts as a tax on the entire global economy, and the 2026 crisis delivered that tax with unusual severity. The transmission is explained below for several key sectors:
- Energy: Fuel, diesel, heating oil, and electricity prices jumped 30-60% in European and Asian importing economies.
- Agriculture: Fertilizer and food transportation costs jumped, pushing up some emerging market food price indices by 1.5-2.5%.
- Manufacturing compression: Embedded energy costs imposed margin pressure on automobile, plastic, chemical and other heavy end users.
- Shipping and logistics toll: Tanker rates and freight costs rose to multi-year high, as insurers charged all Gulf cargoes a war-risk premium.
- Consumer confidence erosion: Sharp pump prices suppressed discretionary spending in the US and Europe and large Asian economies.
- Central bank shutdown: The Fed and ECB Faced stagflationary pressures: oil-driven inflation alongside slowing growth.
- Emerging market currency turmoil: Dollar denominated oil imports rapidly eroded foreign exchange reserves in India, Turkey and Southeast Asian currency markets.
- World demand destruction: The EIA has trimmed its 2026downward to -1.1 million barrels per day versus a February forecast of +1.2 million barrels per day.
- Impact on US headline CPI: Economists estimated a 0.8–1.2 percentage point addition to annual CPI from sustained $100+ oil.
- Government financial drain: Fuel subsidies surged in Indonesia, India and Gulf sovereign oil states, sweeping fiscal deficits wide.
What are experts saying about the Crude Oil Price today?
The expert community has converged on a structured analytical framework for understanding where the crude oil price sits today and where it is likely to go. It consists of a first structural floor of about $68-75; a second structural disruption premium, roughly $5-15 per barrel, representing real and lasting supply chain damage that will not magically vanish with the peace deal; and a third active conflict premium, about $25-30 at its peak, which has transitioned into the spread and is largely priced out following the June 14 peace deal announcement.
Goldman Sachs, which had set its 2026 Brent price at $77 per barrel before raising its forecasts to $85 during the crisis peak, has cut its Q4 2026 Brent forecast to $80 per barrel, with WTI at $75 for the same period. The bank said it expected Persian Gulf exports to rebound back to pre-war levels by the end of July 2026, a scenario leapfrogged courtesy of Trump’s peace deal announcement after calling for an August rebound.
Citigroup has shifted to a more bearish view, estimating a 60% probability that Hormuz shipping reaches normal levels a few weeks after a formal agreement, and that Brent crude oil price could decline to around $70 a barrel in the second half of 2026 due to “the cumulative effect of destroyed demand over many months at triple-digit prices” and a “surge” in non-OPEC supply from U.S., Brazilian and Canadian producers that had increased production during the crisis.
Morgan Stanley aligns broadly with Goldman, keeping a near-cautious tone on the medium-term. All three banks, however, agree on one key point; the structural disruption premium is very real and will continue. As OECD inventories now forecast could drop to their lowest level since data began in 2003, ending up around 50 days of oil supply by end-2026, they can’t be rebuilt in a flash, even if Hormuz reopens tomorrow. The physical infrastructure for drilling, production and tanker movements in the Gulf will take some months to recover.
What has the U.S.-Iran peace deal done to the Brent Crude Oil Price?
The June 14–15, 2026 formal announcement of a Washington–Tehran memorandum of understanding, to be signed in Switzerland on June 19, has triggered what has been the most sensational single-week crude oil decline since the crisis began. The deal, which is said to involve both parties allowing tankers to transit the Strait of Hormuz immediately upon signing, to resume oil sales, and for the United States to allow Iranian oil and fuel sales under a phased sanctions-lifting schedule, has changed the story about the oil market in several important ways:
- The Strait of Hormuz is expected to be open to commercial shipping within days of the June 19 signing, says the parties.
- Iranian oil exports will resume immediately, and the United States will allow Iranian oil and fuel sales under the terms of the MOU.
- Saudi Arabia, UAE, Iraq, Kuwait and Qatar oil supplies are expected to normalize by late July 2026, says Goldman Sachs.
- U.S. Strategic Petroleum Reserve is at a 43-year low; the administration will be under pressure to start replenishing the stocks at sub-$80 prices.
- UAE left the cartel in the middle of conflict; its return and the cartel’s post-crisis output rules are unresolved.
- China withheld Gulf purchases in the middle of the crisis to avoid propping up prices; a restocking wave is imminent.
- Geopolitical risk premium consensus tracks $5–$15 per barrel of embedded premium through end-2026.
- IEA financial model projects a global supply deficit until at least Q4’26, constraining price downside.
- U.S. government restocking demand is a near-term price floor around $70–$72.
- Time to repair infrastructure energy research estimates a 3–6 month window to bring Gulf production infrastructure back to pre-war levels.
How has the 2026 oil price crisis shaped global energy policy?
The 2026 crisis has accelerated structural shifts in global energy policy that were already underway but had been progressing too slowly. The vulnerability exposed by the Strait of Hormuz closure has forced governments, energy companies, and multilateral institutions to reconsider assumptions about energy security that had been in place for decades. An implicit assumption that a stable crude oil price is the background condition of global economic management has been upended.
The IEA emergency reserve release, the largest in its history at 400 million barrels, illustrated the strengths and limits of the strategic reserve system. Emergency reserves – designed to cover 90 days of net imports for member countries – provided significant but insufficient mitigation from the scale and duration of the disruption. The U.S. Strategic Petroleum Reserves falling to a 43-year low is a legacy of the crisis that will continue to shape the energy conversation for years to come.
The energy transition argument has become more complicated, yet also more prescient in recent weeks. The disruption has led to political pressure especially in the United States for increased domestic oil and gas production, as Permian Basin and Gulf of Mexico producers have increased output to meet surging demand from global buyers seeking non-Gulf sources. But the crisis has also underscored, at a visceral level, the vulnerability of hydrocarbon-dependent supply chains for policymakers who had previously viewed energy security as an abstract concept.
NATO member nations have quietly accelerated talks about moving resources away from the Middle East, alongside the EU’s accelerated expansion of LNG import terminal capacity and renewable energy infrastructure. Multiple Asian markets , India, Japan, and South Korea , have officially raised their strategic reserves targets and diversified outward to Atlantic Basin producers such as the United States, Brazil, and Norway.
What is the role of OPEC+ in shaping the Crude Oil Price?
OPEC+ has played an important role through the 2026 crisis , both as a key beneficiary of the higher price level and a major variable in any post-war price recovery. The cartel’s reaction to the war has been made more interesting because a number of its top producers , Saudi Arabia, Iraq, Kuwait, and the UAE , are themselves impacted by the closure of the Strait of Hormuz, preventing them from exporting their production, unaffected by their quotas. As such, the crude oil price trajectory for H2 2026 will be closely linked to how fast Gulf producers can resume exporting and what type of decision OPEC+ will take post-crisis.
A sizable complication is that the UAE decided to exit the OPEC+ cartel amid the conflict, a decision that underscored Abu Dhabi’s desire to ship as much as it can via its Habshan-Fujairah pipeline corridor while the rest of the Gulf is bottlenecked. Whether, and on what terms, the UAE will rejoin the cartel, and whether Saudi Arabia will be willing to return to full OPEC+ compliance at a time when Riyadh needs to wash its own oil facilities clean and monetize every barrel possible, are important open questions.
OPEC kept its 2026 global oil demand growth forecasts unchanged in its March Monthly Oil Market Report, but that forecast was made before the full extent of demand destruction became clear. The EIA’s June 2026 Short-Term Energy Outlook forecasted an overall global oil demand growth for 2026 of -1.1 million barrels per day (bpd) – an almost 2.3 million bpd swing from a pre-recent war unchanged estimate of +1.2 million bpd. If demand is now structurally damaged by a full four months of $100+ oil, OPEC+ may have to adjust its post-war expectations to more severely weakened demand growth than its models anticipated.
The 3 crucial Crude Oil Price scenarios for H2 2026
Nearly all of the possible paths that crude oil price could take during the second half of 2026 are based on the two potential outcomes connected to the current U.S.-Iran MOU, as well as the speed of Gulf supply rebuilding. The three outcomes that dominate the majority of expert commentary cover meaningful probabilities of what could happen, and also cover price ranges that should be expected in each scenario.
Scenario 1: Full Peace Deal and Orderly Supply Restoration
An easy re-opening of the Strait after the signing of the June 19 Switzerland MOU would result in Gulf exports normalized by at least late July (as estimated by Goldman Sachs), resulting in Brent crude price between $72-$82, if the delay premium diminishes as the structural disruption premium on crude closes as inventories are rebuilt. Demand for U.S. SPR restocking and Gulf pipeline, gas, and ship repair will still be coming into play, so a modest price floor around $68-$72 could be seen before any major rally is priced in. This scenario has the highest probability, and is the one most quoted in the commentary that has been available.
Scenario 2: Prolonged Stalemate or Partial Implementation
If the MOU signing is delayed, disputed, or only partially implemented, as has happened with prior diplomatic frameworks during the crisis, the Brent crude oil price could stabilize in the $85–$95 range, with the active conflict premium only partially unwinding. Markets remain highly sensitive to any signal of renewed military action, and the structural supply deficit projected by the IEA through Q4 2026 would keep prices elevated. This scenario would maintain significant upward pressure on global inflation and force central banks to remain hawkish longer than currently anticipated.
Scenario 3: Deal collapses, renewed escalation
A collapse in US-Iran talks due to disputes over the sanctions implementation timelines, the exact verification requirements for Iran’s nuclear programe, or a flare-up involving an Iranian drone or missile, could see the price reversal reverse, opening up the possibility of upper $100s for Brent, potentially even $110–$125 if a significant escalation occurs. This is the tail risk scenario that continues to underpin the market’s hesitation to fully price out the geopolitical premium even as the MOU is due.
What does the Crude Oil Price crisis mean for inflation and interest rates?
A sustained oil shock to the 100s of 2026 may be more dangerous than the 1990-92 Gulf war era and Lucia ’98 as it has a major impact on the main policy metrics used by central banks. An oil shock that is a sustained price increase above $100 per barrel (the April and May 2026 period) has a high probability of spilling over into both headline CPI and core CPI. The spillover into headline CPI has a direct effect on monetary policy and the Fed’s dual mandate.
The spillover into core CPI leads to first- and second-round effects (as described by Citigroup), through the effect of higher energy prices, on transportation and logistics costs that move the core inflation higher. Markets have already started pricing in fewer rate cuts for the latter half of 2026 from the Fed, which has implications for the growth outlook given the global growth environment by the time the cuts are supposed to come.
For many emerging markets, the impact was even starker. In oil importers, such as India, Indonesia, Turkey and the Philippines and most of Sub-Saharan Africa, trade deficits widened, currencies went under pressure against the dollar and central banks were forced to raise rates to defend their reserves against capital outflows. The dollar itself was paradoxically tightening during this period as demand for oil payments, which were to be made in US dollars, was fueling the currency against clean money rivals, while risk-off behavior chased safe-haven currencies, creating even more imported inflation in dollar-sensitive economies.
In the current environment, with the price now retreating towards the $76–$80 range as the peace deal approaches, the question for central bankers is how much of the inflationary legacy is temporary versus permanent, how quickly will these bubble lipsticks from energy end, and is the demand destruction caused by four months of $100+ oil severe enough to warrant raising rates as discussed in the last chapter?
What is the long-term geopolitical risk premium in Crude Oil Price?
One of the most contested questions that have confronted energy economists and geo-strategy analysts since the 2026 crisis has been whether the crisis has permanently shifted the risk calculus that governs global oil markets. Even if the U.S.-Iran MOU is signed on June 19, the deal ratified, and the Strait of Hormuz fully reopened within a matter of weeks, has the world changed in ways that will keep a floor under the crude oil price for years to come? The expert consensus is yes, and for compelling structural reasons.
In the 2026 crisis, for the first time in the modern era, the Strait of Hormuz became fully weaponizable as a tool of interstate conflict rather than merely threatened, as Iran had been doing periodically since the 1980s Tanker War. The actual closure of the strait to commercial shipping for a sustained period of more than three months broke a taboo in energy market risk assessment that had kept many analysts in the era of risk premia in their heads and the cost of risk in their mouths.
A closure probability that some analysts had been assigning to a full Hormuz closure for years and years stood at 2–5%; given the drama and severity of the 2026 crisis, they may be forced to revise that figure to 15–25%, an equilibrium risk premium that will then be carried forward in every barrel of oil that passes through the Gulf.
In addition, the war has exposed the fragility of the international oil infrastructure, which will take years to repair. Energy infrastructure in nine countries sustained damage to at least 40 major assets during the fighting, according to the reports of market analysis firm Borsen from May 2026. Rebuilding oil production capacity, pipeline networks, and port facilities in Iran and the wider Gulf will take years and hundreds of billions of dollars, a long-term structural restriction on supply that the market will price for years to come.
Final Thoughts
The 2026 crude oil price crisis is a hallmark storyline in energy market history, a severe compression of years of geopolitical risk into four months of lightning volatility, from a wartime $70 per barrel baseline to a $115+ peak, and now on the decline back toward the $76–$80 level as a peace deal comes to the table. But it would be textual to describe this as a resolution. The structural damage to oil supply chains, strategic reserves and energy infrastructure around the globe is deep, and it will take as long to heal.
On June 17, 2026, market participants are pricing an optimistic but fragile base case – timely signing of the MOU on June 19 in Switzerland; an orderly reopening of the Strait of Hormuz; normalized Gulf crude oil exports by late July; and gradually the crude oil price in the $70–$82 range through year-end. We see a price lag in the low $70s, with Goldman Sachs pegging Q4 Brent at $80 and Citigroup estimating $70 is realistic. But the structural premium to price makes it likely that most analysts will consider anything below $70 as an unlikely floor.
The 2026 energy crisis is a shock to policymakers, energy planners and investors, who should never have thought that energy security could ever be taken for granted, that strategic reserves had to be kept at levels higher than ever before, that supply chain diversification was an existential necessity, and that geopolitical risk should be properly priced into oil markets after February 28, 2026.
It is a shock to consumers, who probably never realized just how many of the goods and services they use in daily life are priced in a barrel of crude oil, no matter how the market redefines the currency of our modern world — from fuel costs to food prices, utility bills and the price of virtually everything else made in the process of living.
The crisis is getting less intense, but the reverberations — from inflation data, central bank policy to energy security doctrine and the embedded risk premium in every barrel of crude oil — will hang over the market for years.
Why is the crude oil price falling today?
Crude oil prices are falling today due to growing optimism surrounding a framework agreement between the U.S. and Iran. The deal is expected to reopen the vital Strait of Hormuz to global oil tankers and restore Iranian petroleum exports, significantly easing global supply fears and draining the conflict-driven risk premium.
What is the crude oil price today?
Crude oil is trading around $75 to $78 per barrel today.
At what price does India buy crude oil from Russia?
India buys Russian Urals crude oil at an average price of approximately $82 per barrel as of June 2026.