
Crypto prices tend to behave in recognizable patterns and one of the most effective tools to grasp them properly is support and resistance, which are two fundamental technical analysis terms that every crypto trader, from a beginner to an expert, needs to know.
What is Support and Resistance?
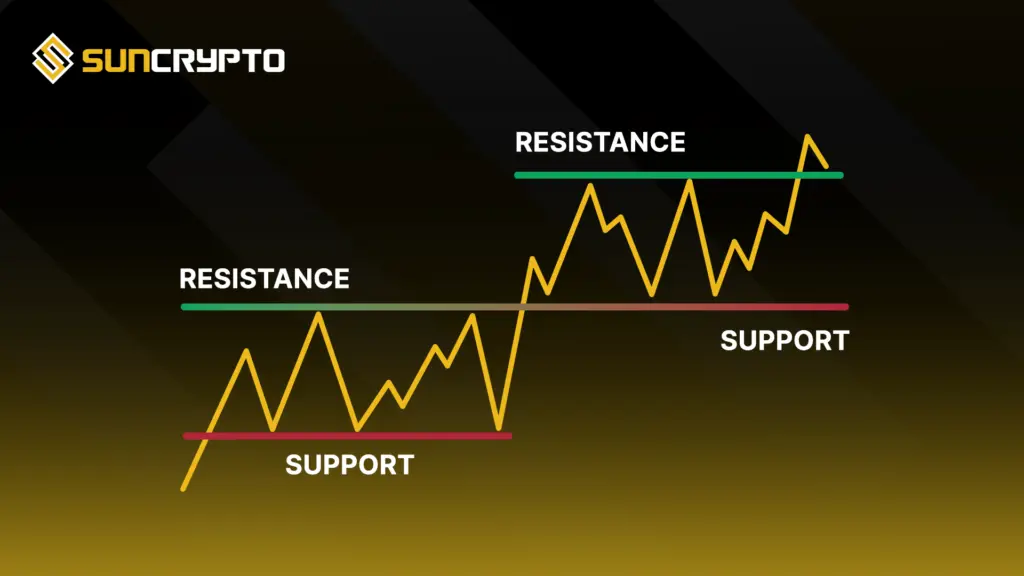
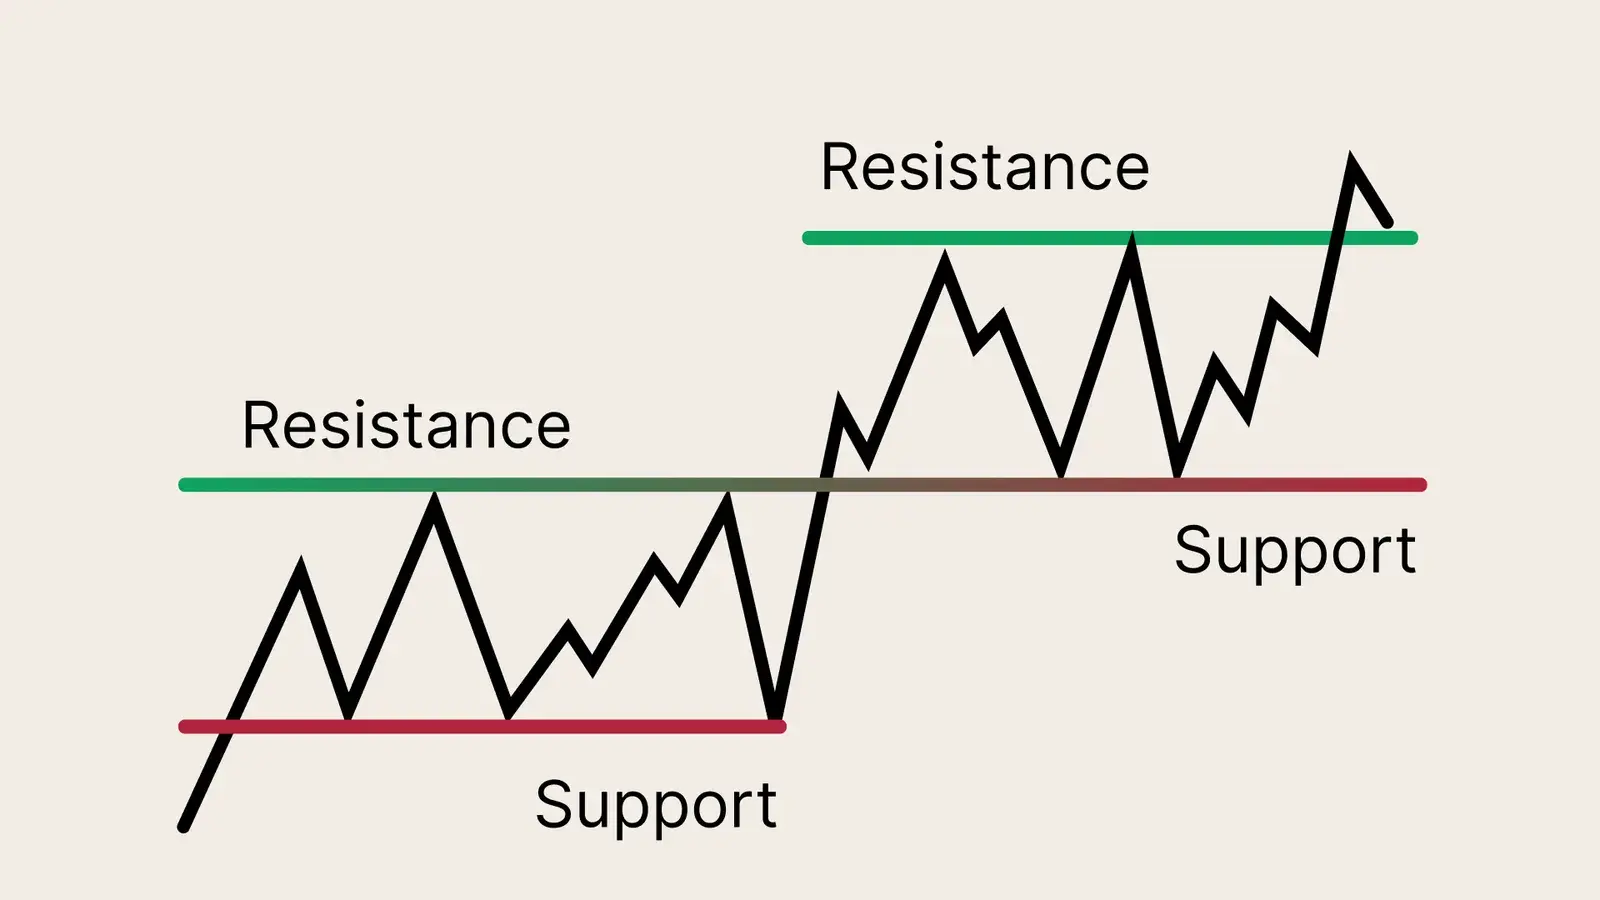
Support is a price level or swing area that has seen sufficient buying pressure over the past years and prevents the price from meaningfully declining further, and Resistance is a price level or swing area with enough selling pressure over the years to halter the price’s rise further.
In simple terms, support will be a “floor” under the price and the resistance will be a “ceiling” over the price. Once the price gets in close proximity with either of these barriers, the price can bounce or break through; either action has significant trading indications.
These levels are not just “lines on a chart”. They are the average actions of thousands of market participants that use identical historical price information to make decisions. These levels are therefore delicate and strong tools that can show traders possible price reversals, breakouts, rejections, and breakdowns, providing beneficial entry and exit signals along with threat management zones.
Why are Support and Resistance so important in crypto?
Crypto markets are extensively speculative and function 24/7. This makes the psychological dimensions of support and resistance especially pronounced compared to traditional markets.
If a price has sustained a level multiple times in the past, traders expect it to hold again. This expectation starts to become self fulfilling— buyers converge on resistance and sellers converge on support. As a result, these areas act as a focal point of liquidity and determine the actions of markets in known directions.
Key support levels at $102,000 and $101,450 have determined Bitcoin’s recovery potential in recent months, while failed resistance at $105,050–$107,000 has signaled ongoing institutional caution; a real-world example of how important these levels can be. These levels will always be employed as a strategic benchmark and psychological key in a dynamic market, so traders and investors need to be careful and attentive in using them.
How do Support and Resistance levels actually work?
To grasp how these price levels work, one needs to look deep into the market psychology in crypto. Let’s say there’s a set of traders who purchase Bitcoin for $50,000. The price rises to $55,000 and then pulls back to $50,000. Those same buyers, and now others who couldn’t get in on the first round, are ready to buy again at that same point. This collective memory of price creates a zone of demand — a support level.
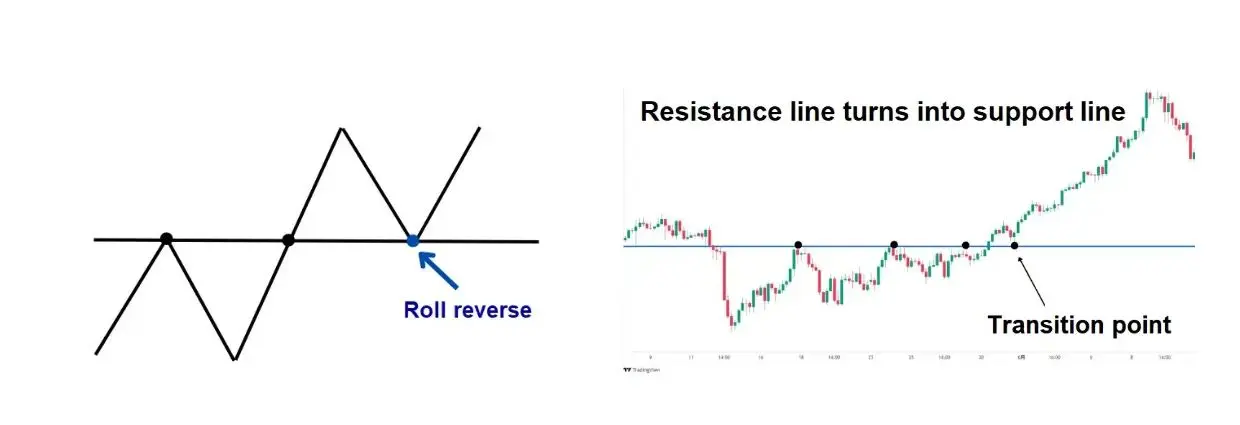
The same applies for resistance, but in reverse. Sellers who had exited positions at a particular price will often re-enter positions at or near the same price, thus forming a supply ceiling. When a support or resistance level is broken, its role is reversed, which means if the price falls below a support level, that level will become resistance, and if the price rises above a resistance level, it will often become support. This concept, known as role reversal, is one of the most practically useful ideas in all of technical analysis.
How to identify good Support and Resistance levels?
Identifying areas of high-quality price zones isn’t based on blind luck. This is what traders check for to confirm the strength of a support or resistance areas:
- Multiple touches: The greater number of times a level is tested, the more important and trustworthy it is.
- High volume: Zones with high volume are for areas where the institutions and large traders are trading.
- Historical price actions: Price levels tested repeatedly in the past are more likely to hold in the future.
- Role Reversals: A broken support becoming resistance (or vice versa) adds an extra level of confidence.
- Round numbers: The reason that prices such as $50,000 or $100,000 are usually so popular, it’s because of human psychology.
- Moving averages: 50 day and 200 day moving averages can often serve as dynamic support and resistance.
- Shifting zones: Formed by diagonal lines between higher lows (up trend) or between lower highs (down trend).
- Fibonacci retracement levels: These aim to show price region areas based on derived Fibonacci mathematical calculations that tend to form support or resistance.
- Timeframes: Weekly and monthly time frames have significantly more influence than that of an hourly chart.
How to use these levels in your trading plan?
Once you have found the reliable price zones, the next step is when you put them in line where you have a proper trading strategy. There are three main strategies traders would take on based on support and resistance.
Bounce Trading involves buying near support where prices appear to be supported and selling near resistance when it struggles to break higher. The theory behind bounce trading is that prices tend to retrace at certain levels when the price comes off a familiar support level, it may turn back up because there are more buyers than sellers. One or two stops beneath the support zone is often a stop-loss that can reduce your risk of loss.
Breakout Trading does the exact opposite. Instead of fading the move at a barrier, traders go long or short on the break. It is vital to place entry points close to support levels where maximum gains can be made, stop-loss orders just below support levels to ensure less risk taken and take-profit orders just below resistance levels to secure profit. Keep in mind that a successful penetration above resistance or below support, particularly if the volume increases, is a sign of starting a big new trend.
Liquidity Grab Strategy is a more advanced approach when traders wait for a short period to see a false break (bounce) in a support or resistance level before they enter the current trend. It takes advantage of “stop-loss” clusters where they build up just outside these areas and is especially effective in very liquid cryptos with a high concentration of liquidity.
Difference between a breakout and a fakeout
A failure to reach an important level is not necessarily an indicative trend reversal. There is one popular trading mistake that many new traders make and that is when they get the fakeout confused for a breakout. Below are the ways to tell them apart:
- True breakout: Price closes a position of interest with volume above and holds the candles.
- Wick rejection: Only the wick breaks level leaving the body open — a typical fake out.
- Low volume breakout: A breakout that occurs with weak volumes usually lacks institutional interest and tends to fail.
- Immediate reversal: When price moves straight back again to the range within 1 or 2 candles, it is probable that the price movement occurred because the market was being ‘hunted’.
- Confirmation candle: If you wait for the next good candle that is full before getting into the trade, this sure will lower your chances of getting fooled.
- A busted volume spike: A legitimate breakout will generally also have a large volume rise.
- Retest: When price breaks a level, it will likely come back to retest it again (this time as a support level).
- Price action: Slow gains at the time of breakout may indicate lack of vigor.
- Momentum technique: An RSI MACD divergence near the breakout point can signal lack of momentum.
- Market context: Breakouts that coincide with the market direction are much more likely to hold.
- News catalysts: Essential events, regulatory news, etc. can cause genuine breakouts.
How do Support and Resistance fit into a broader trading plan?
It is seldom enough to make use of these price areas individually. The most effective traders apply a combination of support and resistance and use a mix of tools and risk management factors. These are not collective quantitative levels, but zones where price tends to react, these need not be used in conjunction with different other tools, resources and methods to validate the analysis and boost trading success.
When paired with tools such as the Relative Strength Index (RSI), volume oscillators, and moving average crossovers, they become way more predictive and powerful. To shelter capital from damage if it breaches the established support level, allow for the use of stop-loss orders to be taken slightly above an established support level. To secure gains in periods of healthy up trend, use TakeProfit level(s) above established resistance areas as success keeps accruing.
These levels are dependent on market sentiment and tend to repeat over time and can serve as strong indicators that provide a framework with which to operate trades, manage risk and make meaningful trading decisions. One of the things that every investor could have that would be of great help, especially when they are either short traders or long traders, would be knowing previous market actions.
Final Thoughts
The concept of support and resistance are among the oldest and most popular in the crypto trading world, and with good reason. Their job is to make sense of the voluminous and unpredictable price movements in the market and break it down into simple, meaningful price zones for trading. The possibilities of applying the two concepts are endless – from the identification of prime entry/exit levels to reducing risk and spotting trend reversals.
However, there is no level that is impossible to get through. Markets change, sentiment turns and the best price support is short-lived. The main thing is to remember that these levels are not hard and fast principles but probable probability frameworks that help you have a better edge in your favor. These zones, when combined in conjunction with volume big-picture analysis, technical indicators and sound risk management, can meaningfully move your performance up a level in any market situation.
Disclaimer: Crypto products and NFTs are unregulated and can be highly risky. There may be no regulatory recourse for any loss from such transactions.
What is the best way to use Support and Resistance?
The best way to use support and resistance is to view them as zones rather than exact lines, and trade using the break and retest strategy. This approach prevents you from buying too early or chasing the market, keeping your trades disciplined.
How to spot these levels?
To spot these levels accurately, look for price peaks, valleys, and heavy trading areas where the market historically reversed direction.
What is role reversal?
Role reversal is a market phenomenon where a broken support level flips to become a new resistance level, or a broken resistance level flips to become a new support level. It is one of the most reliable and widely used concepts in technical analysis.