
The Bitcoin 200 week moving average has just broken above $60,000 and continues to climb even further. For long-term investors and seasoned traders, this development carries far more weight than a short-term price swing. It is a strong indication of Bitcoin’s long-term baseline “recalibration” and history has proved that the impact of this indicator will be profound.
What is Bitcoin 200 week moving average?
The Bitcoin 200 week moving average is the average of the closing price of BTC over the past 200 weeks (close to 4 years). Unlike daily or monthly average prices, this indicator helps to remove the short-term volatility and speculative fluctuations to give a direction of the trend of Bitcoin. Sloping upward, the line indicates the growth of the monetary value of BTC over time, irrespective of the likely fluctuations that one might observe from week to week.
Why does it matter so much? Because, it has time and again proved to be the best cycle bottom indicator with near perfect historical track record. In every major bear market since 2015 — including the brutal 2018 crash and the 2022 crypto winter — the Bitcoin 200 week moving average has served as the final floor before Bitcoin recovered and went on to set new all-time highs. Blockstream CEO Adam Back has even said that, in times of market correction, it is a “mathematical floor” to such a degree that it remains the most reliable indicator for crypto analysis.
How was the Bitcoin 200 Week Moving Average first tracked?
In particular, the 200 week moving average became a legitimate sign when Bitcoin’s first major post-halving bear market bottomed out near $200. Analysts noticed that BTC’s price seemed to gravitate toward this long-term average during its most distressed periods.. That’s what led to the creation of one of the longest-lasting analytical models in crypto history.
Now, let’s take a look at the changes in this indicator over each major market cycle:
- 2015 Bear Market Bottom (~$200): It took place squarely on the 200WMA and BTC then entered into a multi-year bull run that saw it reach the November 2017 level of $20,000.
- 2018–2019 Bear Market Bottom (~$3,200): The 200WMA held as support, and BTC recovered to set a new ATH of $69,000 in November 2021.
- 2020 COVID Crash (~$3,850): A brief violent dip below the 200WMA was followed by an explosive recovery — the indicator acted as a springboard.
- 2022 Crypto Winter: The one time BTC made it sustainable below its 200WMA is 2022 Crypto Winter, which lasted about 16 months. Despite this, Bitcoin bounced back and hit a new high of $126,000 in October 2025.
- Early–Mid 2026 (~$57,926 → ~$61,000): Bitcoin rallied in the vicinity of the 200WMA as it nearly dipped to its previous ATH in October 2025 and managed to stay above the 200WMA ever since.
See, the pattern has always remained the same; when BTC touches the bottom every single time, the Bitcoin 200 moving average has been tested, and it has served as the launchpad for the next Bull Cycle.
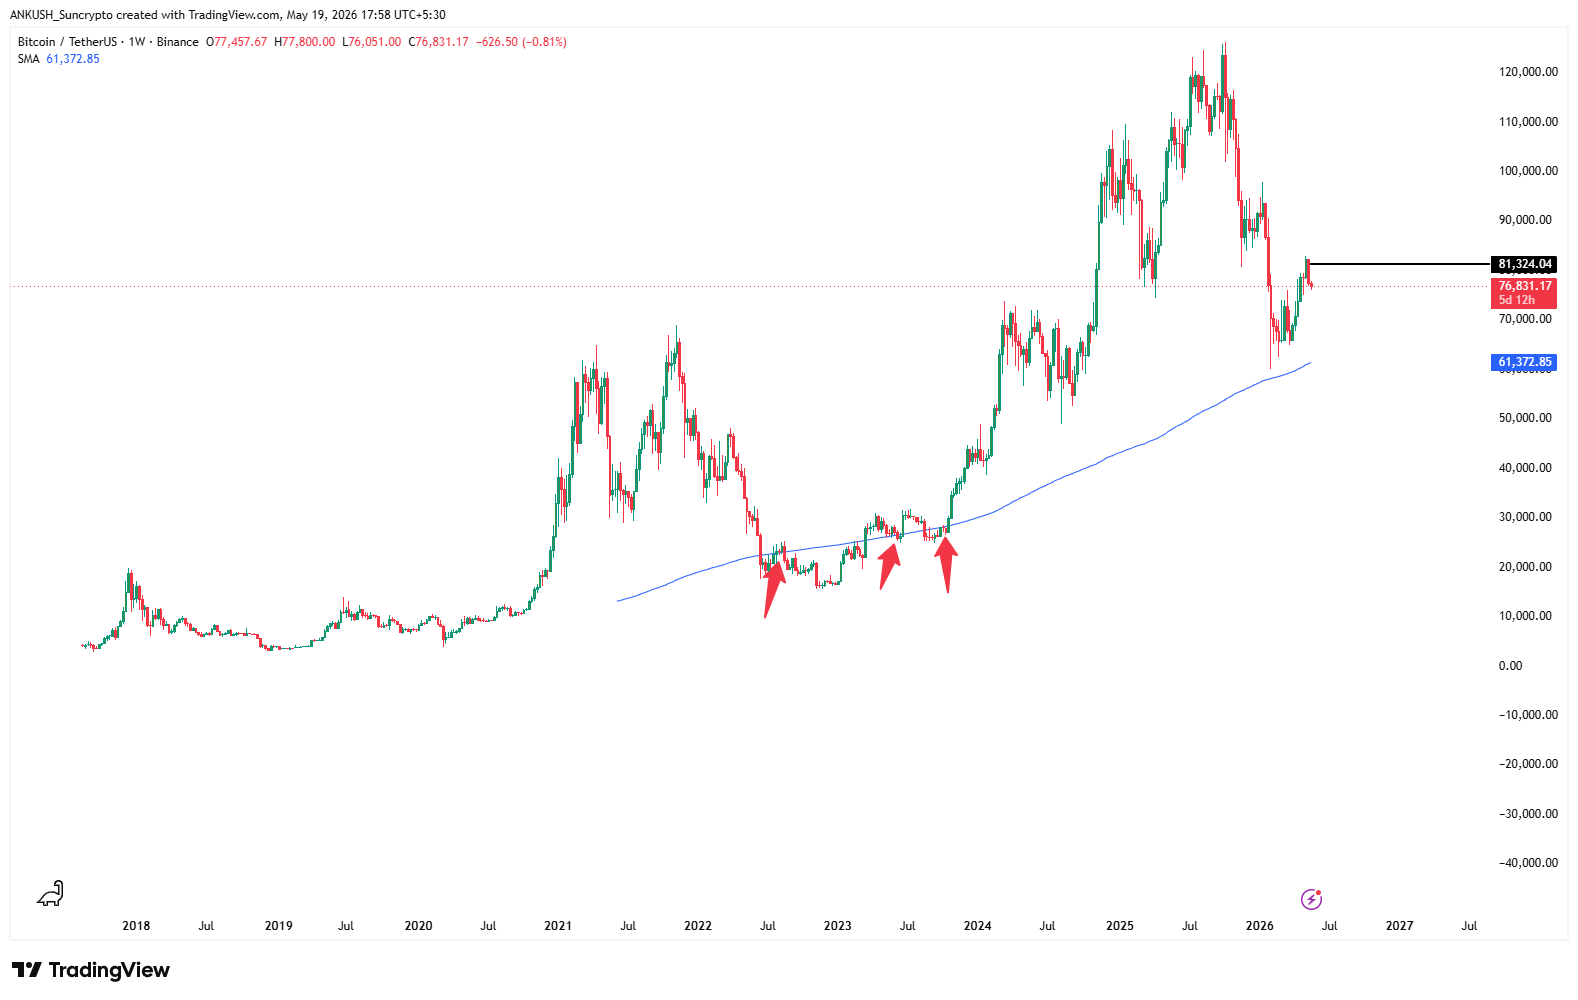
Image: BTC chart pointing at the 200WMA of 2018, 2022 and 2026
Where does the Bitcoin 200 Week Moving Average stand in 2026?
Bitcoin 200 week moving average 2026 is currently trading around $60,517 marking a steady rise from the start of this year’s early February at $57,926.This ongoing ascent matters because it reflects BTC’s long-term baseline rising organically, driven by years of higher prices being incorporated into the average.
The Bitcoin 200 week moving average current value, which stands at ~$60,517, aligns with a price-to-moving-average ratio of approximately 1.28–1.30. This ratio indicates that Bitcoin is trading at a value that is around 30% higher than its historical average. This is considered a healthy level of price premium, as it does not indicate the market is overvalued or undervalued. This ratio is compared to the level during the bull run in 2021, when it was above 4.0. A 1.30 ratio is quite good because there is ample space to run before a market is structurally stretched.
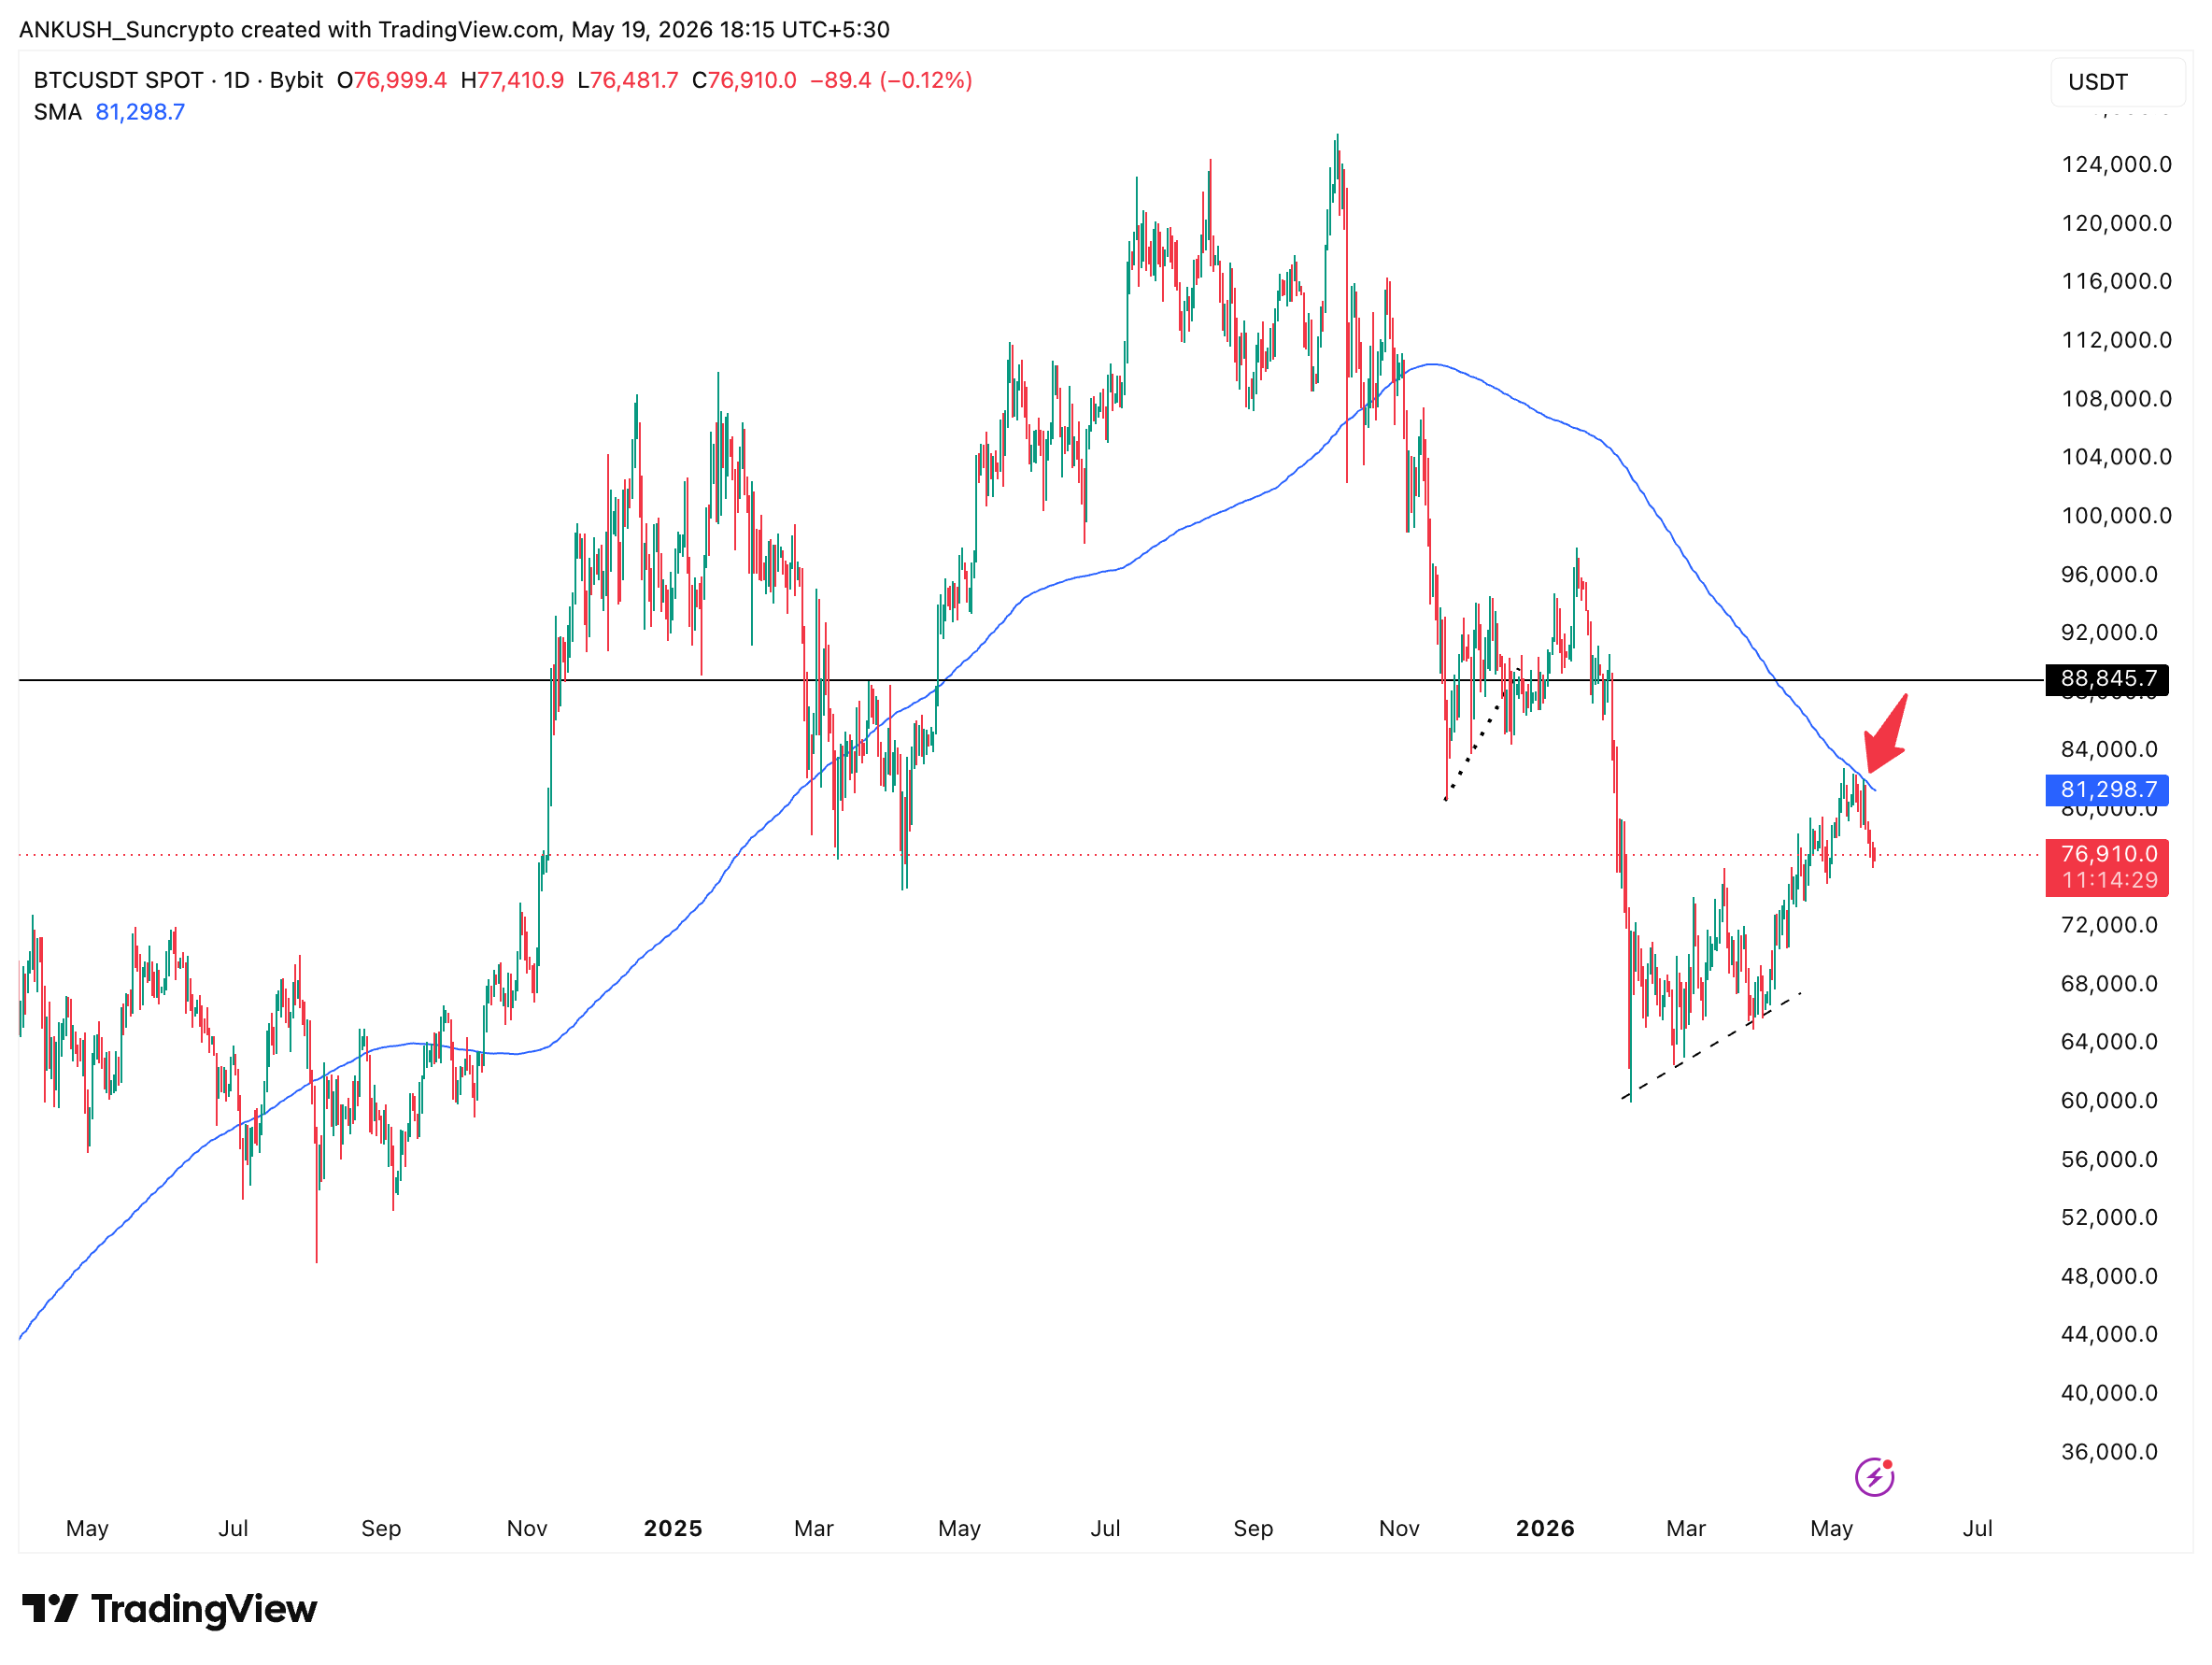
Meanwhile, the Bitcoin 200 day moving average current value sits near $81,300–$82,842 ,a different and shorter-term metric that Bitcoin has struggled to reclaim since January 2026. This really does indicate a nice structural foundation, but the daily average is providing an overhead resistance (level) in the current market situation that would dictate that the grain be considered a near-term overhead resistance strength in the market.
How do traders use this indicator?
It’s not a background indicator, it’s one of the essential tools in the professional and retail traders’ tool kit. Traders basically use it in the following ways:
- Cycle Bottoms: Traders try to find the bottoms in the market by observing, when the market price gets close to or on the 200WMA for extended downtrends, the price zone is considered a high conviction long term buy.
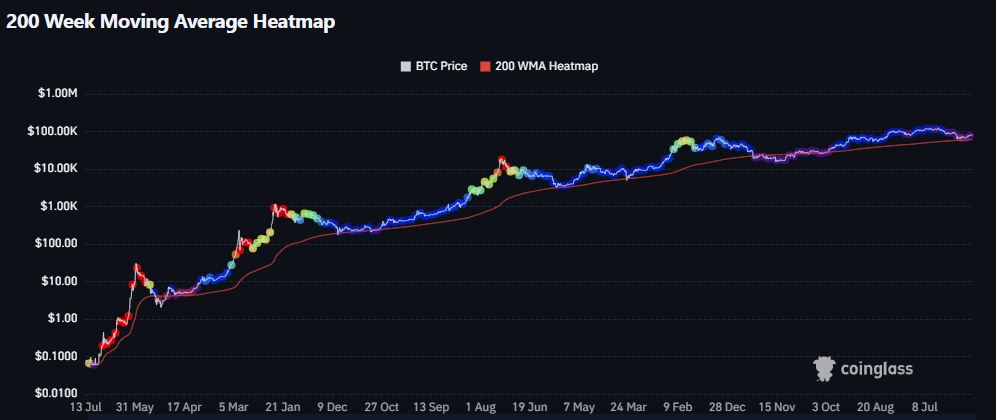
- Tapping in/out with the heatmap: The Heatmap relies on color coding the price action according to how far BTC is moving above his 200WMA. Historically purple/blue zones (close to the average) indicate undervaluation and potential buy and orange/red zones indicate over valuation and potential sell targets.
- Confirmation of trend direction: A rising 200WMA confirms that the long-term trend is bullish. A flattening direction shows structural weakness. The Bitcoin 200 week moving average has formed an uptrend and the crypto appears to be in a macro bull market as of now.
- Filtering out noise: Since the 200WMA covers data for four years, it ignores short-term fear and greed cycles, helping long-term holders avoid selling low at important bottoms that are not a sizing up of the entire picture.
- Setting risk parameters: Many institutional traders employ the 200WMA as their absolute price action floor and only sell when they see BTC candles close weekly below the indicator, for a number of weeks in a row.
What is Bitcoin’s current price?
Bitcoin is trading around $77,000–$80,000 in mid-May 2026, having recovered from an April low near $62,500 and briefly touching $80,052 recently. Institutional demand is also making a healthy resurgence, while some corporations have been buying up large, such as Strategy, who has recently added 4,869 bitcoin for $2.01 billion (an average price of $80,985 per coin) between May 11 and May 17, now totaling its holding to 843,738 BTC, at an average price of $75,537—a strategy that helped value rise during the difficult start to the year. ETF inflows have slowly started to trickle back in.
Structural support for Bitcoin is expected well below its current price level, given the fact that it is around the $61,000 level with the 200 week moving average. The near-term fight, though, is being waged at the Bitcoin 200 day moving average (DMA), which sits around $82,300 but has been unable to break above since October 2025. Breaching this level will represent the first true bull market sign of the year, which could create strong upside momentum.
Bitcoin could, on the negative side, challenge the longer-term 200WMA support level if it were to drop towards the bottom of the $61,000 – $63,000 range. This scenario finds most long-term trading analysts watching this indicator, given its historical behavior and the increasing floor it sets, as a buying opportunity, rather than a structural alarm.
What are the macro headwinds keeping Bitcoin below its 200-Day Average?
While the Bitcoin long-term moving average indicator (200 weeks) has been bullish, the short-term price conditions haven’t been favorable:
- Geopolitical Risk: Oil prices surged above the $100 mark as escalating tension between the U.S. and Iran caused markets to respond in a risk-off manner. According to Coinglass data, around $600 million in crypto places were liquidated in just an hour after President Trump sent out his alerts in early 2026.
- Inflation resurgence: Producer Price Index (PPI) posted its largest annual increase since the end of 2022, gaining 6% to further strengthen the Federal Reserve’s case for continued high interest rates. A high rate makes the relative attractiveness of non-yielding assets, such as Bitcoin, less appealing.
- ETF flow reversal: Bitcoin spot ETFs recorded a net outflow of approximately $1 billion for the week ending May 15, 2026, as they sapped close to $2 billion of net inflows spanning six weeks. The short-term reversal has sparked a cumulative net inflow of over $58 billion since the spot ETFs were launched.
- 200-day MA rejection: Bitcoin has encountered the moving 200-day average at $82,300 several times but has failed to surpass the level. It has been trading near the moving 200-day average at $82,300 on several occasions, but has not been able to close within the average. A failure to perform has caused technical traders waiting on the same level to instigate selling pressures.
Final Thoughts
The steady climb of the Bitcoin 200 week moving average above $60,000, and towards $61,000 as of mid-May 2026 is not just a technical footnote; it is a meaningful structural milestone.. History clearly demonstrates that whenever this indicator is challenged, Bitcoin has bounced back and eventually skyrocketed to new heights.
Near-term inflation pressures have been a headwind, as has been geopolitical risk in recent weeks, while resistance at the weekly 200 day period around $82,300 has also posed issues and challenges, but the overall macro bull picture is still positive.
Disclaimer: Crypto products and NFTs are unregulated and can be highly risky. There may be no regulatory recourse for any loss from such transactions.
When was the first Bitcoin 200 week moving average?
The indicator first served as a critical price floor during the bear market bottom of January 2015.
What is the latest Bitcoin 200 week moving average?
Bitcoin’s 200-week moving average (200WMA)—a key long-term structural trend indicator—is currently tracking in the $60,000 to $62,000 range.
Why is this indicator important?
The Bitcoin 200 week moving average (200WMA) is important because it serves as the ultimate cyclical floor and structural “line in the sand” for Bitcoin’s macro price cycles.