The RSI indicator is among the most popular and easy-to-use indicators that crypto traders rely on. No matter whether it’s a beginner or a seasoned crypto trader, mastering the use of this momentum oscillator can be valuable in the long run. This guide takes you through all of the things you need to know about it. So, let’s jump right into it!
What is RSI indicator?
The RSI indicator stands for Relative Strength Index, which is used in the technical analysis that shows speed and magnitude of the recent price changes of the underlying asset. It was created by J. Welles Wilder Jr. and was introduced in his 1978 book New Concepts in Technical Trading Systems. This concept was initially created to be used mainly in the traditional markets but has since turned into a vital tool for crypto trading as well.
It is plotted on a range between 0 and 100 under a price graph, and is used by traders to determine if an asset is overbought or oversold. Readings below 30, generally indicate that the asset may be oversold and is in need of a bounce or recovery in price, while readings above 70 usually signal that the asset is over bought and is in need of a pullback. The middle of 50 indicates a degree of balance between bullish and bearish momentum.
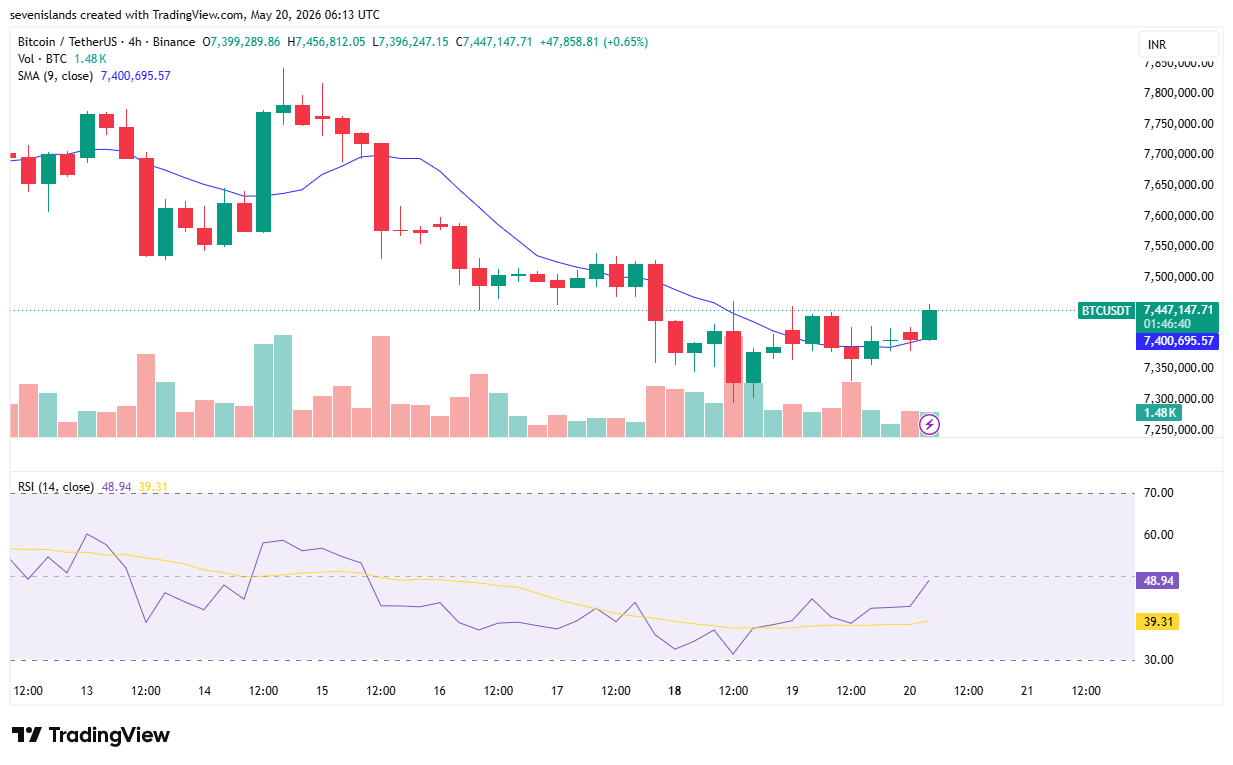
Image: Current BTC chart 48.94 Relative Strength Index (balanced)
What is the RSI indicator formula?
Understanding the RSI indicator formula is key to grasp what is going on under the hood. There are 2 steps of calculations and these calculations are based on the default look-back period of 14 candles or periods (whatever period you are using, hourly, daily or weekly).
Step 1 — Initial Calculation:
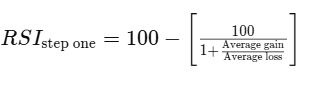
If, for example, in the past 14 days a crypto asset has closed 7 days with an average gain of 1%, and 7 days with an average loss of 0.8% then the first Relative Strength Index value would be about 55.55.
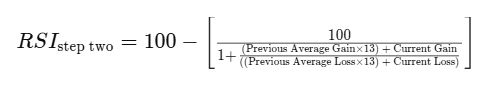
Step 2 — Smoothened Result:
This second step smooths out the result, preventing the oscillator from swinging wildly and hence is more reliable to conclude a trend analysis. This provides traders with a dynamic, and continuously updated momentum reading once plotted.
What are the ideal RSI indicator settings for crypto?
One of the most common questions beginners ask is about the optimal RSI indicator settings for the crypto market. The default is a 14-period look back window which works very well for swing traders and most common time frames. But crypto’s volatility can often make for a few adjustments.
Below are some of the most typical period settings for a trader, depending on their trading style:
- 5–9 periods: Day traders with a short-term time horizon may find this suitable for them with high sensitivity.
- 14 periods (default): A balanced response, best for swing traders on a 4-hour or daily chart time frame.
- 21-30 periods: Smoother yet and slower; favored by longer time frame investors who monitor major trends.
- Overbought level: The typical overbought level is 70, but during strong bull runs, traders might be tempted to increase it to 80.
- Oversold level: It is the level where buying decisions are made upon, traditionally 30 although during bear markets, it is often lowered to 20 for accuracy.
- Timeframes: Shorter time frames (15-min, 1-hour) have more signals but also more noise.
- Combining with volume: Using volume with this can be a confirmation of signal power.
Experimenting with these settings on a demo account before going live is always a good practice in crypto trading.
What are RSI indicator buy and sell signals?
The most practical use of this oscillator is identifying RSI indicator buy and sell signals. These signals serve as a way for traders to gauge how much momentum the market possesses, and to make informed decisions on when to buy or sell based on that momentum.
A buy signal is likely when the Relative Strength Index is below 30, which is in oversold territory, and then above 30. The crossover mainly suggests the pressure has backed off and a price recovery may be beginning. If the trend appears to continue higher, a pullback to the 40 to 50 range, followed by a bounce back up, is also considered to be a strong indication of ongoing upward trend, and hence bullish.
A sell signal is a reading that moves from overbought to oversold conditions as it passes the 70 level and plunges below it. Overall the buy signal seems to be getting weaker with this and a price correction could be imminent. In a downtrend, traders are looking for a reversal after reaching 50-60, this is a good sign of a bearish reversal.
One important note to remember is that a signal cannot be analyzed without considering the other signals. The oscillator can be used with other indicators and charts like moving averages or candlestick patterns for better signal reliability.
How to adjust the RSI value according to the trend?
One of the distinguishing factors between beginners and the more advanced traders is the ability to recognize that the overbought and oversold levels are different according to the market cycle. Popular market technician Constance Brown, CMT, suggested that in an uptrend, the overbought level isn’t quite 70, but is actually much lower; in a downtrend, the oversold level isn’t quite 30, but actually much higher.
When a strong downtrend is followed, the oscillator tends to peak near 50 rather than 70, making that level a more reliable signal of bearish conditions. In a bull market, however, it is rare to see the indicator dropping below 30 and instead moving around 40-50. This is where many traders address the issue; by drawing in the dynamic horizontal trendlines at updated levels to better reflect the evolving market conditions. One must also note that it generally works best in range-bound markets, ranging up and down, than it does in any strongly trending market: Often the indications are false alarms in strongly trending markets.
What is RSI divergence?
Perhaps one of the most powerful concepts associated with the RSI divergence indicator is divergence analysis. The divergence condition is one that sets into play when the price of a crypto asset is going in one direction (up or down), but the oscillator is going in the opposite direction, before a price reversal occurs.
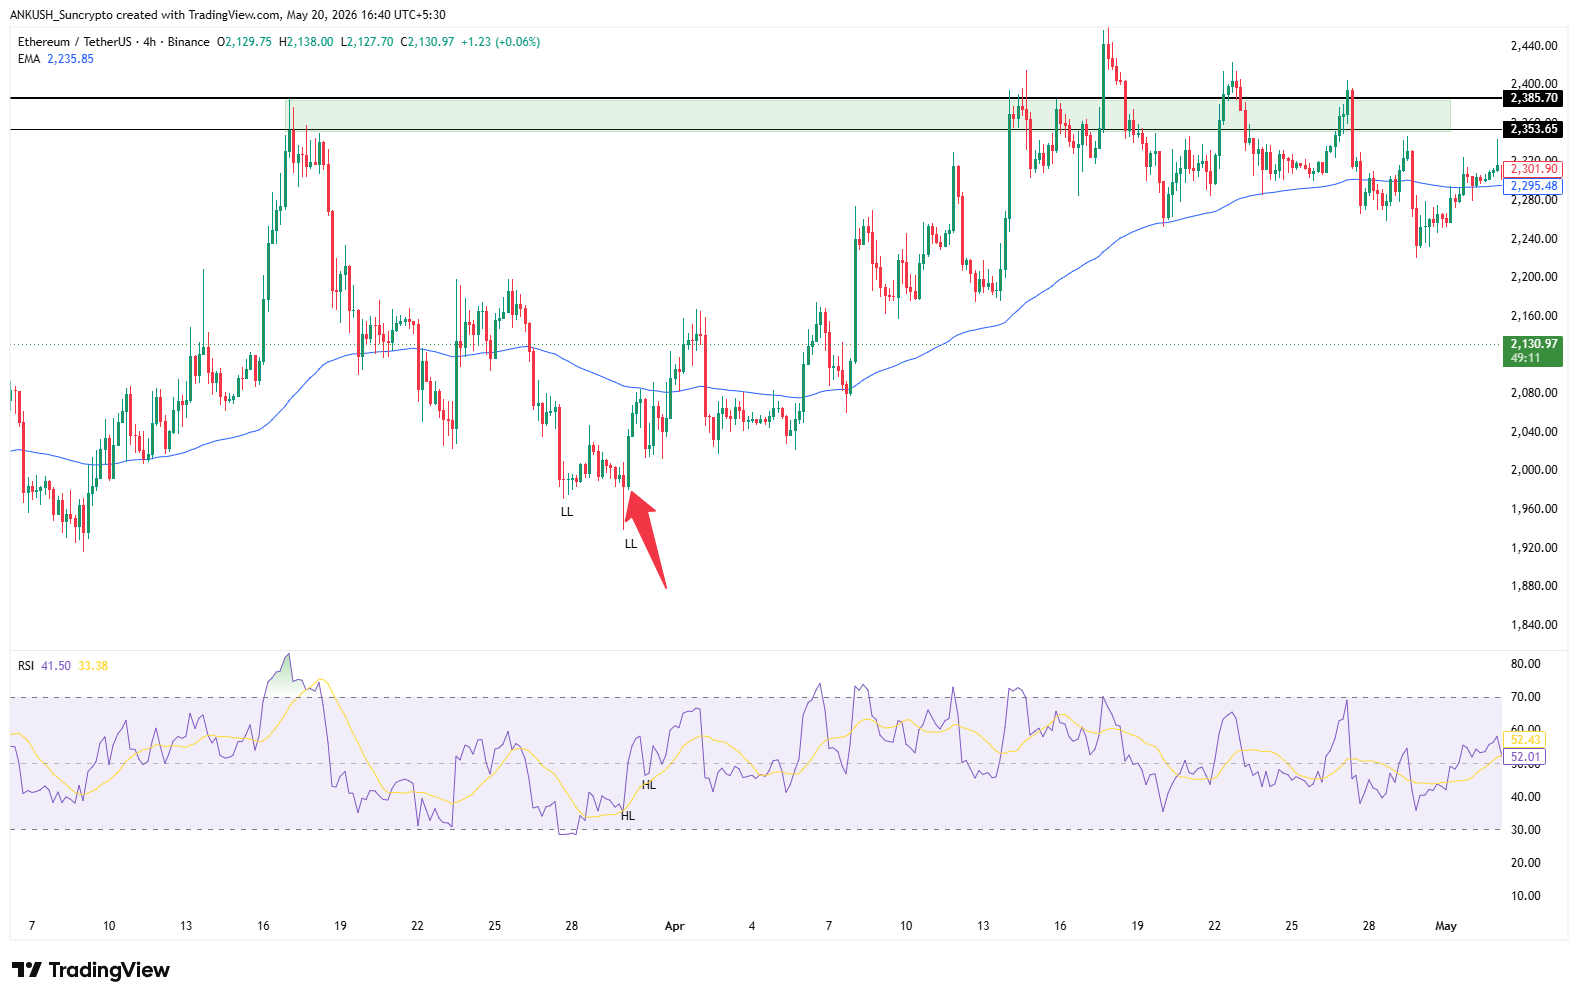
- Bull Market Divergence: The price creates a lower low, and the RSI indicator creates a higher low. This indicates that although prices remain under downward pressure, they have started to sell off slowly, indicating that they may be ready to turn back higher.
- Bearish Divergence: Price creates a higher high, but price’s Relative Strength Index creates a lower high. This suggests that buying momentum is not as strong as it has been in the past as prices keep climbing up — a sign that things could soon go downhill.
The most effective time to use divergence signals is when they are reinforced by other ingredients of a good support or resistance level and well in with the overall market structure. Divergence can be a good extra confirmation indicator if the crypto markets are very volatile at times. In a stable long term trend it is also important to remember there can be many divergences that occur prior to the reversal.
What are Positive and Negative RSI Reversals?
The concept of Relative Strength “reversals” is very similar to “divergences” but counters the direction of the indicator. When the price breaks up through important support zones with the oscillator just as much breaking below the crucial price support, it gives a positive Relative Strength Index indication if it’s a bull market. Despite the indicator making a weaker low, the fact that price held higher is considered a bullish sign and can act as a buy signal.
The opposite is a negative reversal, in which the oscillator forms a higher high while the price forms a lower high. This bearish formation indicates that the price momentum is also cooling down, albeit for a short period, during this brief spike off the floor, indicating you may want to consider selling.
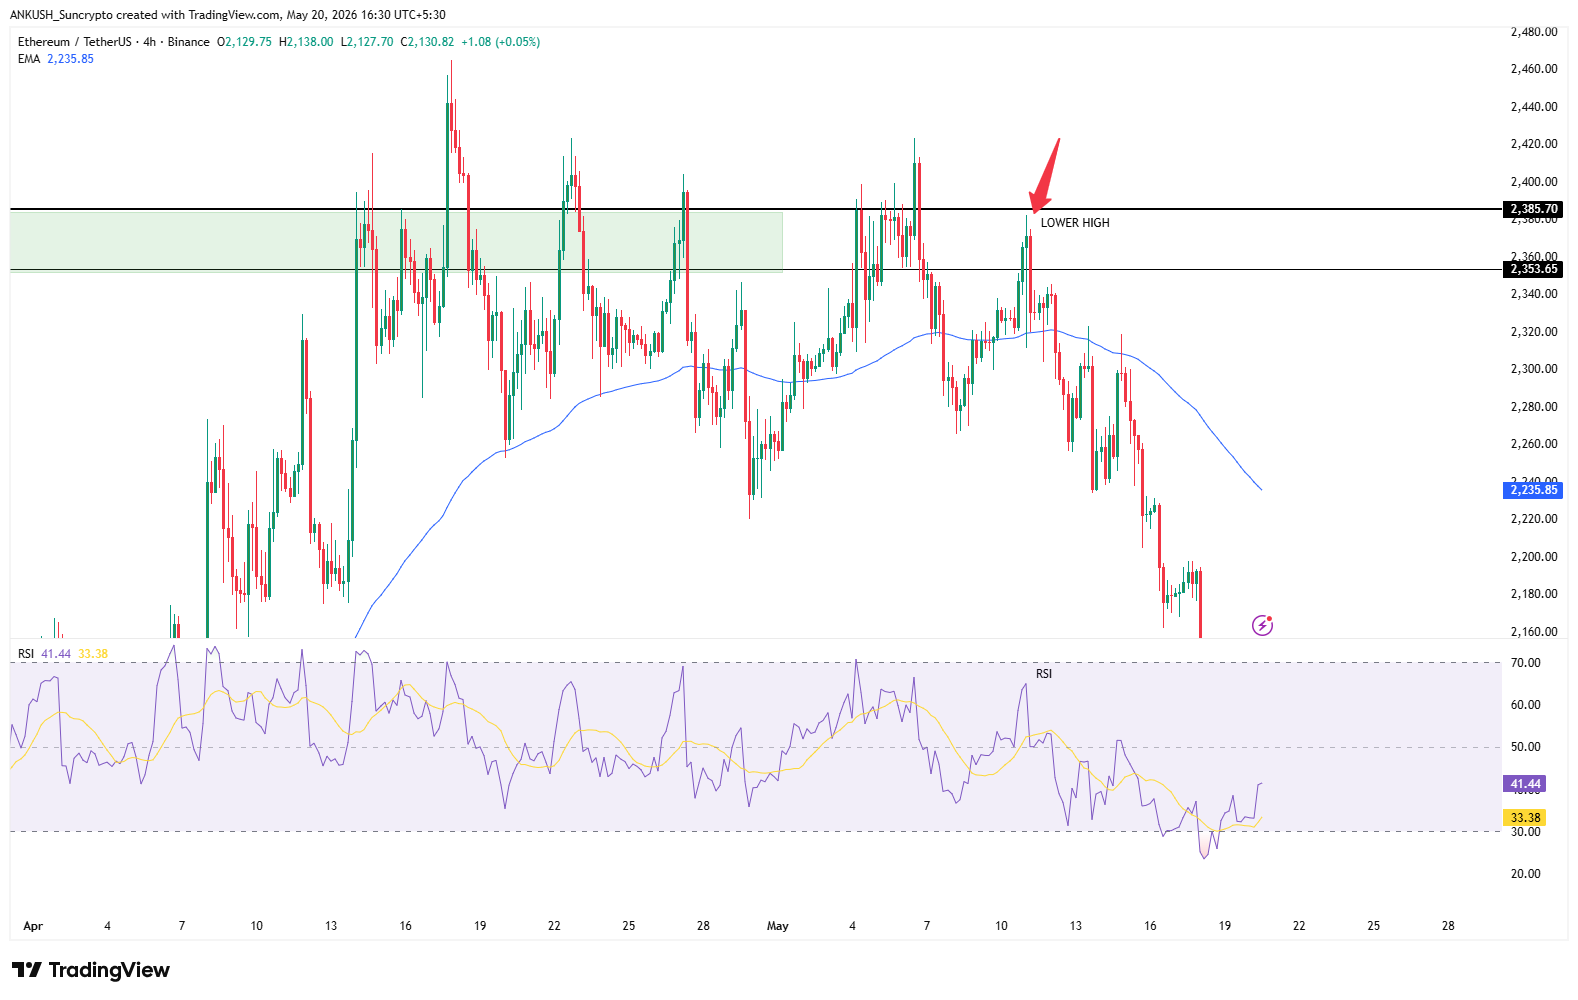
Image: Example of Positive & Negative reversal in Ethereum
The one thing that differentiates it from divergence is directionality; divergence has the indicator moving ahead of the price, while reversals have the price moving ahead of the indicator. Every trader in the cryptocurrency market can avail of the benefit of identifying the pattern forming and enhance that timing of getting in as well as out from the trades fairly significantly.
How does RSI Swing Rejection signal trade entries?
A stronger use of this momentum oscillator is “swing rejection”, which is a valuable component to any RSI indicator strategy. It shows how the oscillator reacts when it moves out of overbought/oversold situations, when it aligns with the prevailing trend.
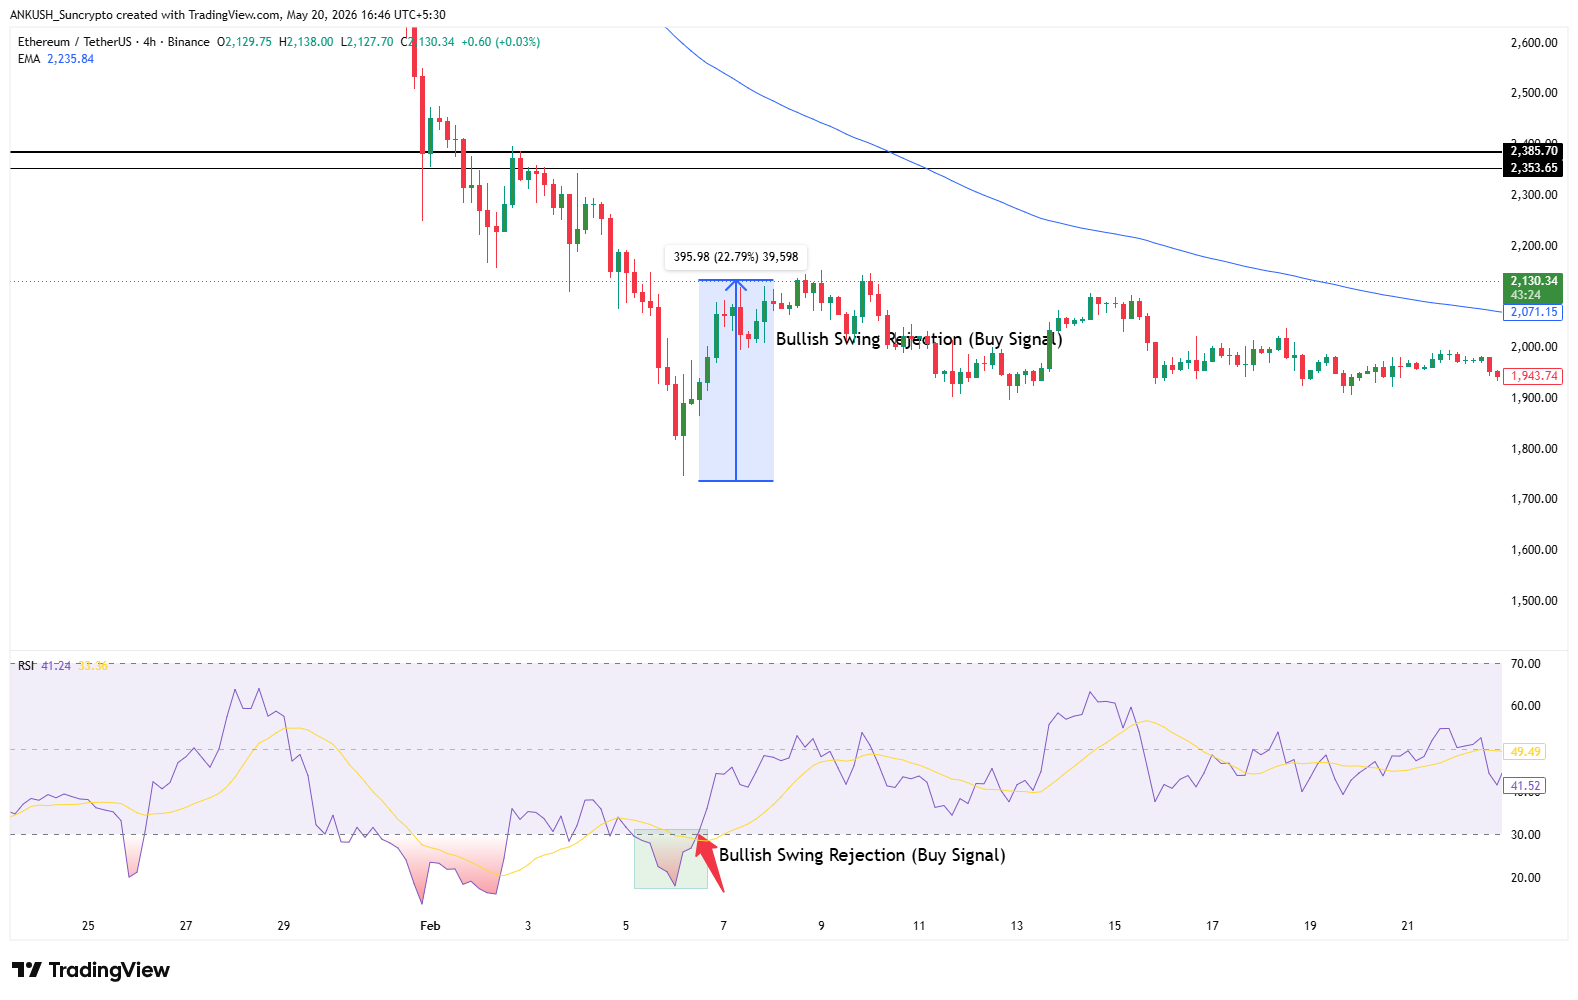
There are four steps to a bullish swing rejection:
Step 1: The RSI drops below 30, indicating oversold conditions.
Step 2: It comes back up above its 30 level.
Step 3: It moves back but doesn’t retest oversold conditions.
Step 4: The indicator has moved higher than the previous highest level, which is the signal for the buy trade!
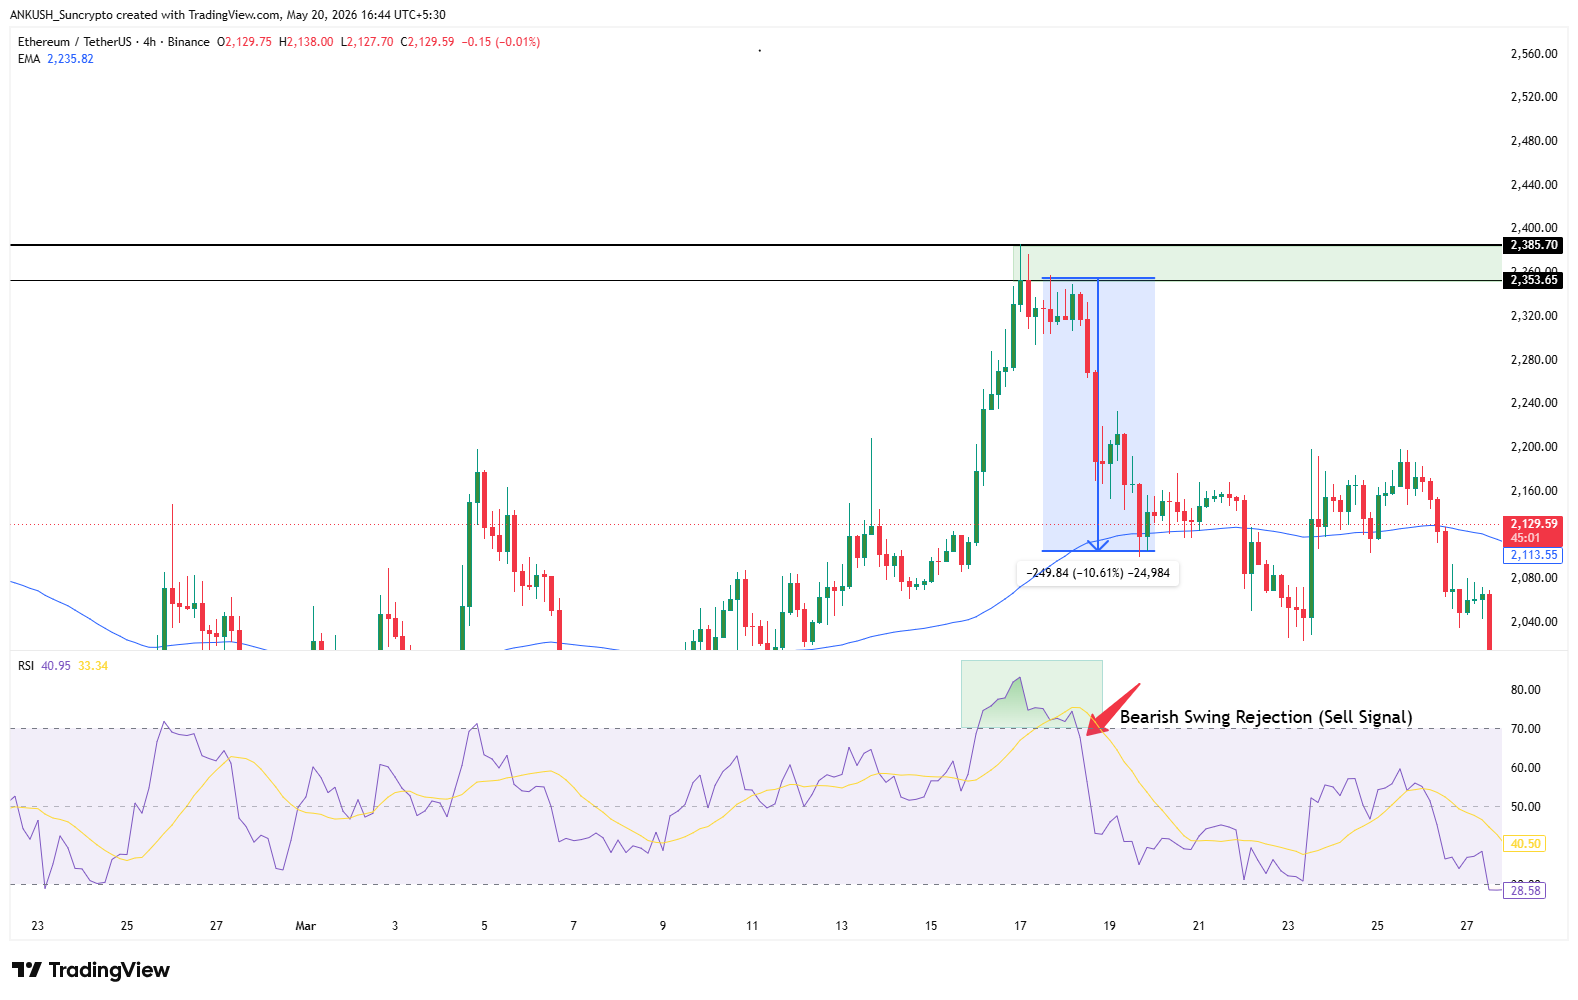
 A bearish swing rejection is the opposite of the bullish swing rejection, and similarly consists of 4 steps:
Step 1: RSI moves out of the range of 20-80 and above 70.
Step 2: It dips below the 70 level.
Step 3 – The indicator heads back over the top but fails to break back into overbought conditions.
Step 4: It breaks below its most recent low — this is the trade trigger.
The purpose of swing rejections is to be able to tell when the swing is going against the longer term trend the most. Bullish rejections in uptrends and bearish rejections in downtrends are most unlikely to yield false signals.
What is the difference between RSI and MACD indicator?
The RSI indicator is a useful tool for spotting oversold and overbought conditions; however, it works best in conjunction with other tools. The most popular companion is the MACD (Moving Average Convergence Divergence), which is another momentum oscillator that is used to show how the relationship between two moving averages of price changes over time.
The main difference is that the Relative Strength is a complete indicator of price momentum against recent price ranges while Moving Average Convergence Divergence is based on the meeting and separation of moving averages to indicate trend direction and price momentum transfers.
If they do agree, say when the MACD and RSI are both bullish, then there is a significant chance to have a profitable trade. If they do contradict, care should be taken. In certain instances, Relative Strength Index with reading over 70 merged with the MACD signal with the down momentum continuing are not to be disregarded either and more confirmation is needed before making the next move.
What are its disadvantages?
All tools have their positive and negative side and so is the case with the RSI indicator. These are the main drawbacks that crypto traders must know:
- False positives: A bullish crossover is formed, yet price keeps moving down heavily.
- False negatives: A bearish crossover forms, yet the price keeps climbing strongly regardless..
- Extended overbought/oversold readings: The oscillator can be extreme results in long rallies or pullbacks.
- Not so consistent: Signals in strong markets can be often misleading.
- Prone to volatility: Significant fluctuations can add noise to the trading signals.
- Relying on others for confirmation: Always needs confirmation by other indicators to respond to the signals.
- Lagging nature: Momentum based, hence it reacts to price action, and doesn’t flag it.
Final Thoughts
For both beginners and seasoned traders, the RSI indicator is one of the most useful and simple signals that helps in crypto trading. Whether it’s grasping the formula, customizing the parameters, interpreting buy and sell signals, looking for divergences, swing rejections, or positive and negative reversals, learning this oscillator can significantly improve your investing choices in the rapidly changing crypto space.
Disclaimer: Crypto products and NFTs are unregulated and can be highly risky. There may be no regulatory recourse for any loss from such transactions.
What is RSI indicator?
It stands for Relative Strength Index. It is a popular momentum indicator used in technical analysis to measure the magnitude and speed of recent price changes of an asset.
What is the Relative Strength Index formula?
The Relative Strength Index is calculated using a two-step formula based on a standard 14-period lookback window. The first step formula is RSI = 100 – [100 / (1 + (Average Gain / Average Loss))]. The second formula is RSI = 100 – [100 / (1 + ((Previous Average Gain × 13 + Current Gain) / (Previous Average Loss × 13 + Current Loss)))]
What is the best RSI setting?
The standard 14-period setting is universally considered the best baseline RSI configuration, but there is no single “perfect” setting. The optimal configuration depends entirely on your specific trading style, timeframe, and asset class.