

Ethena price has witnessed strong selling pressure since 2025 and has dropped below the 200-days exponential moving average. However, this bearish trend has halted near the $0.070 level which could attract buyers. Any strong bullish momentum can attract bulls which could lift the price to the psychological level of $1.
Ethena price overview
At press time, Ethena (ENA) price was trading at $0.0811 and has remained neutral in intraday. It has a market capitalization of $772.72M and the 24-hour trading volume is $95.92M.
Its circulating supply is 9.56B ENA and the total supply is 15B ENA. ENA coin price was trading 94% down from its all-time high. Ethena price has remained extremely bearish since 2025 and has dropped below the key moving averages on a daily timeframe.
Ethena price analysis
The ENA coin price has experienced strong selling pressure on the daily timeframe. Amid this downtrend, ENA attempted multiple times to break above a major resistance zone of $0.140 between February and May 2026, but failed. Consequently, sellers gained strength and kept the price restricted below this level.
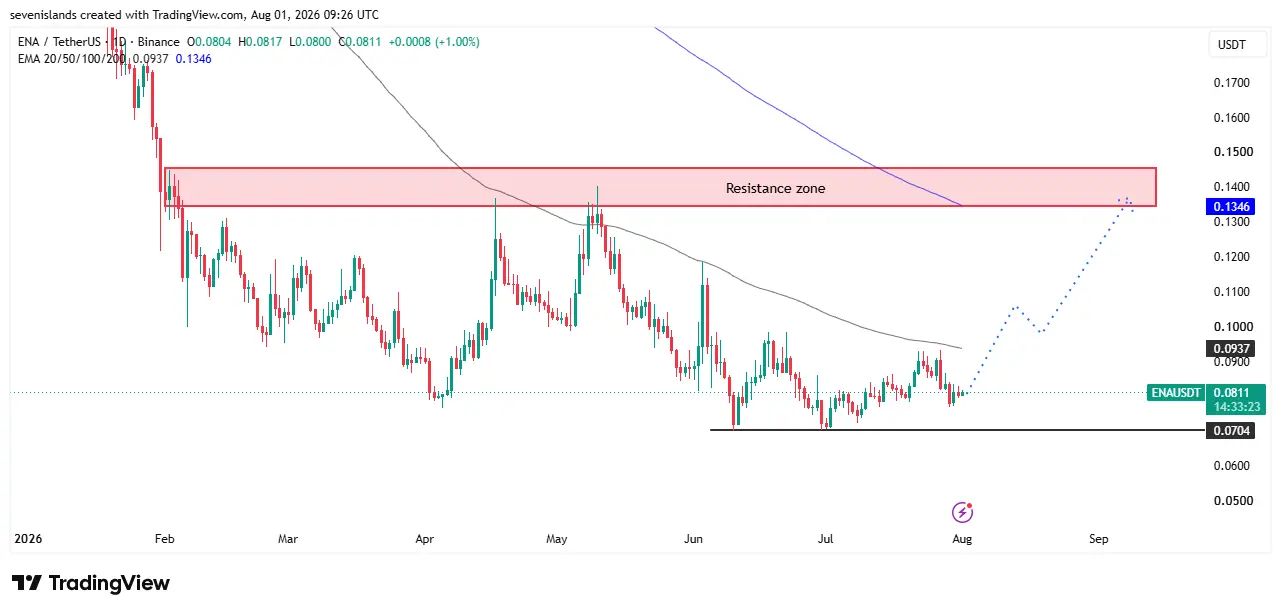
Since June, the price tapped the $0.070 support level twice, gaining mild bullish momentum. Backed by this buying pressure, ENA climbed to its 100-day EMA, where it met initial selling resistance.
Potential Scenarios
- Bullish Breakout: If ENA manages to break above the 100-day EMA, buyers could target the 200-day EMA, which lies just beneath the major resistance zone. Surpassing this resistance zone could allow buyers to dominate the market and potentially trigger a bull run.
- Bearish Reversal: Conversely, if the price fails to clear the 100-day EMA, sellers are likely to retain control. Currently, selling pressure is pushing the price back toward the immediate support level of $0.070.
- Downside Risk: A breakdown below the $0.070 support level could trigger aggressive selling, potentially dragging ENA to a new all-time low.
Can Ethena reclaim the $1 mark?
The bearish trend seems to be halted near the $0.070 zone on a weekly timeframe according to the technical chart. Furthermore, buyers seem to be active in this territory which could be a bullish sign.
Suppose the price gains bullish momentum in this territory, a major bull run can be anticipated. If the price reaches the 100-days EMA, strong buying momentum can be expected and can extend to the $1 mark.
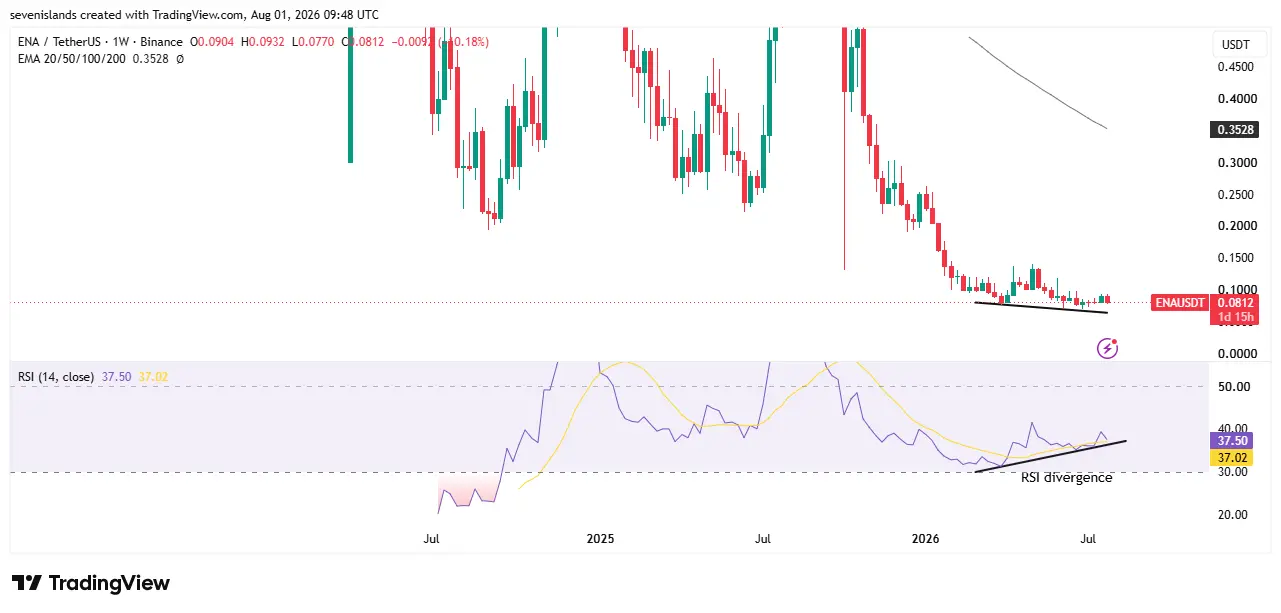
RSI has formed a bullish divergence on the weekly timeframe. While the price broke below its previous swing low, the RSI held its own, hinting at emerging bullish momentum.
That said, the broader technical structure suggests sellers remain in control. Any confirmation of bearish continuation from here could trigger a strong downward move, potentially dragging the price to a new all-time low.
Final thoughts
Ethena’s price action reflects a market at a crucial crossroads. While the broader trend since 2025 has remained bearish, with ENA trading well below its key moving averages, the recent defense of the $0.070 support zone alongside a weekly RSI bullish divergence hints that seller momentum may be fading in this territory.
A decisive close on the Daily timeframe above the 100-day EMA would be the first meaningful signal that buyers are regaining control, opening the path toward the 200-day EMA and the $0.140 resistance zone. Only a sustained breakout beyond this zone would put the psychological $1 mark realistically back on the radar, and that would likely require a much broader shift in market sentiment and sustained volume support, not just a short-term relief rally.
On the flip side, failure to hold the $0.070 support could expose ENA to fresh downside risk, potentially pushing the price toward new all-time lows. Given the token’s 94% drawdown from its peak, traders should treat any bullish signals with caution and watch for confirmation through volume and follow-through price action, rather than reacting to a single indicator like the RSI divergence in isolation.
What is the key support level for ENA coin?
The $0.070 level has acted as strong support, with ENA price testing this zone twice since June and attracting mild buying momentum each time. A breakdown below this level could expose ENA to further downside risk.
Can Ethena price reclaim the $1 mark?
A move back to $1 would require ENA to first break above its 100-day and 200-day EMAs and clear the $0.140 resistance zone. Only sustained bullish momentum and a broader market sentiment shift could realistically support such a rally.
What does the RSI bullish divergence mean for ENA?
On the weekly timeframe, ENA price failed to defend its previous swing low, but the RSI defended its own swing low, forming a bullish divergence. This can be an early signal of weakening seller strength, though confirmation from price action is still needed.