

XRP price has been in a bullish trend since mid-August and has witnessed a decent gain of 70%, reaching the $1.7 mark. However, it failed to hold, and a mild profit booking was observed. The XRP coin price has undergone a correction phase after the bullish rally. The trading volume has also increased slightly, which might impact the price movement further.
What is driving the XRP price beyond the charts?
1. Regulation: A Court Win, but No Law Yet
Ripple won its SEC case, but that win was a district court ruling, not a statute. Traders hoped the CLARITY Act would make that clarity permanent. On 15 September, the Senate voted 49-50 against opening debate on the bill, 11 votes short of the 60 needed. XRP fell nearly 8% after the vote. The vote was procedural, so the bill is not permanently dead. Ripple CEO Brad Garlinghouse expects the SEC and CFTC to keep making rules to fill the gap.
2. ETF Demand: Steady Inflows, Volatile Returns
US spot XRP ETFs have pulled in about $1.72 billion in cumulative inflows and hold about $1.40 billion in net assets. Money kept flowing in even as XRP slipped from its late-summer highs. Inflows have not shielded investors from swings, though. The first US XRP ETF, XRPR, has lost about 60% since its September 2025 launch.
3. RLUSD and the XRP Ledger
Ripple’s RLUSD stablecoin crossed $2 billion in market cap in August, with about $963 million issued on the XRP Ledger. It is backed 1:1 by cash and equivalents, with monthly Deloitte attestations. This shows growing institutional use of the ledger, but it does not directly increase demand for XRP. XRP’s only role in that activity is collecting network fees.
4. Network Activity and Supply
Daily payment volume on the XRP Ledger topped 1.1 billion XRP in September, more than double the 30-day average of 494.6 million. On the supply side, 62.879B XRP is in circulation out of 99.986B total, with a hard cap of 100B.
XRP Price Overview
At press time, XRP price was trading at $1.41 with an intraday gain of 1.4%. Its market capitalization was $88.962B and the 24-hour trading volume was $4.329B. Its circulating supply is 62.879B XRP, total supply is 99.986B XRP and the maximum supply is 100B XRP.
XRP Coin Price Analysis Over Daily Timeframe
The cryptocurrency market has remained volatile for the past few weeks which made a positive impact on most of the altcoins. XRP coin has performed positively amid this volatility. After a strong bullish momentum, the price has undergone a correction phase on a daily timeframe.
XRP price has taken support on the 100-days EMA on a daily timeframe and has surged by 14% in 4 days. Since late August, the price has been struggling to close daily timeframe candlestick over the $1.5 mark.
If XRP price triggers a breakout from this level, buyers might be interested. Once the asset price closes over the $1.5 level on a daily timeframe, trading volume and OI can be increased. A breakout from this level can lead to a bullish trend and can replicate the previous bullish move.
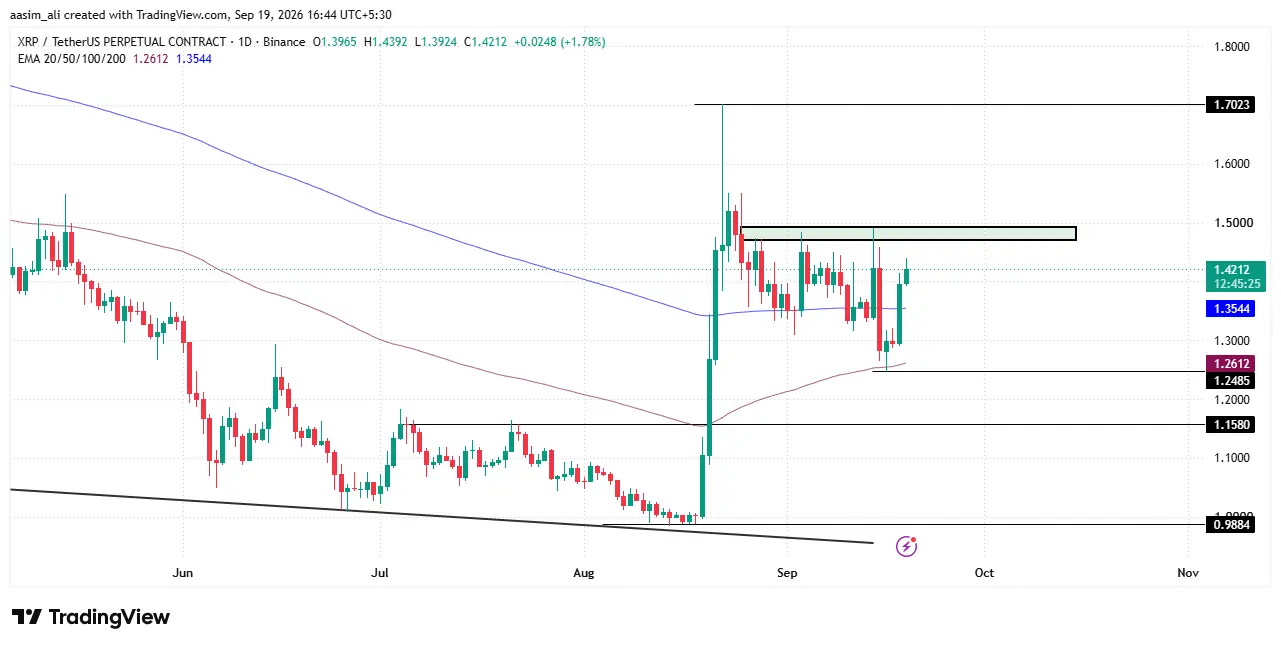
On the other hand, if buyers fail to push the XRP price over the $1.5 mark and the price slips below the $200-days EMA then profit booking can last longer. Once the price slips below the 100-days EMA, the price may melt to the next support level of $1.15 level.
XRP Price and Volume Analysis
XRP price has spent the past month digesting one of its sharpest rallies of the year. After trading near $1.00 in mid-August, the token surged roughly 50% and touched about $1.52 on 24 August, backed by daily volume that peaked near $18.6 billion. Now trading around $1.40, XRP remains roughly 40% above its pre-rally base, and volume has settled at $1 billion a day, about double its early-August norm. Since the peak, price has moved between $1.25 and $1.55, with resistance at $1.50-$1.70 and support near $1.24-$1.30.
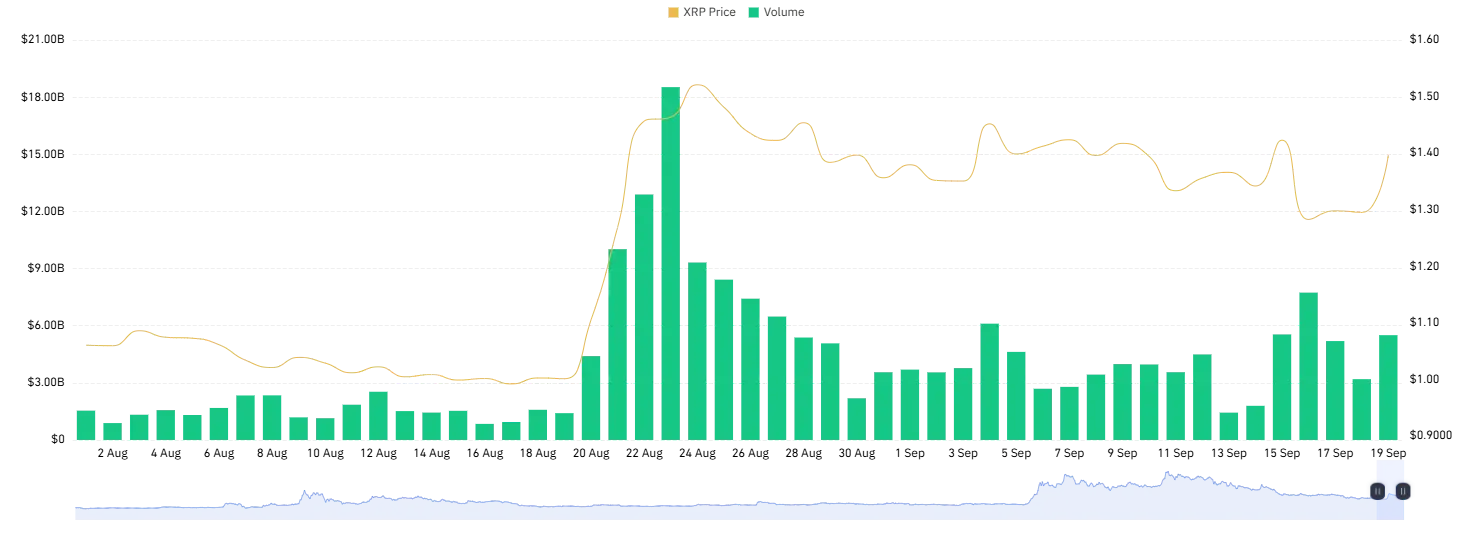
A daily close above $1.47 on rising volume could open a retest of $1.52 and possibly $1.60. If volume stays subdued, sideways trading is likely, while a break below $1.24 could push XRP toward $1.15 and eventually the $1.00-$1.05 base. The next move likely depends on whether buyers clear $1.47 or sellers force a breakdown.
Final Thoughts
XRP’s climb from around $1.00 in mid-August to the $1.52 high on 24 August was one of its strongest moves this year, and the current pullback looks like consolidation rather than a trend reversal. That holds as long as the price stays above the 100-day EMA and the $1.24-$1.30 support zone. Buyers have defended the 100-day EMA and pushed the price up 14% in four days, but the $1.47-$1.50 zone has capped every attempt to close higher since late August.
The next move depends on that zone. A daily close above it, backed by rising volume and open interest, could open a retest of $1.52 and then $1.60-$1.70, and a rally like the previous one becomes possible. If buyers fail again, XRP will likely keep moving sideways between $1.25 and $1.55. A break below $1.24 would expose $1.15 and, in a deeper correction, the $1.00-$1.05 base. Traders should watch volume as closely as price, since a breakout without volume is more likely to fail than to trend.
Why is XRP price in a correction phase?
XRP price rallied roughly 50% from about $1.00 in mid-August to a high near $1.52 on 24 August. Traders then booked profits, and the price has moved between $1.25 and $1.55 since the peak.
What are the key support and resistance levels for XRP?
Resistance sits at $1.47-$1.50, with a wider zone up to $1.70. Support is near $1.24-$1.30, and the 100-day EMA has also held so far. XRP price has struggled to close a daily candle above $1.50 since late August.
Can XRP repeat its previous rally?
It is possible, but XRP needs a daily close above the $1.47-$1.50 zone on rising trading volume and open interest. That could open a retest of $1.52, then $1.60-$1.70. Without volume, sideways trading is more likely.