

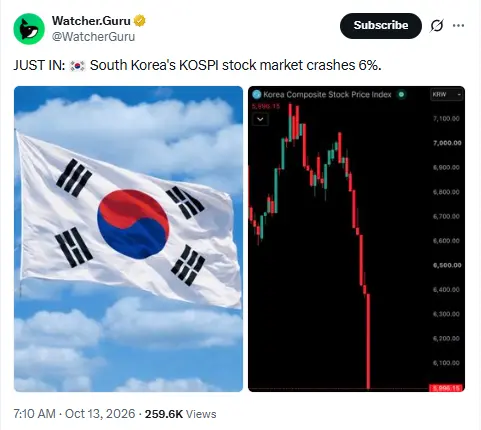
South Korea’s KOSPI has lost about 14% in a week. On 13 October it fell 5.46% to ₩6,035 after an intraday low of 5,911, its weakest level since late July. A week earlier, on 2 October, it had closed at ₩7,004. The KOSPI’s downturn was led by the very stocks that had fueled the market’s gains. Samsung Electronics and SK Hynix, which together represent nearly half of the index, dropped as much as 7.47% and 4.00%, respectively, on Tuesday, as renewed concerns over the AI chip boom weighed on investor sentiment.
Source: X (@/WatcherGuru)
Why the market fell
Four pressures hit the KOSPI together, and the first two matter most because they target the same two stocks.
- Chip anxiety. Reports that China’s memory maker CXMT is advancing quickly revived fears that Samsung and SK Hynix will lose pricing power. The worry first took hold in late July, when CXMT’s market debut jumped 466%.
- Foreign selling. Foreigners sold a net ₩20.3 trillion (about $15.1 billion) of KOSPI shares in the month to early October, mostly SK Hynix (₩12.0 trillion) and Samsung (₩5.2 trillion). Their share of the KOSPI’s total market value has slipped to 39.7%.
- Macro and geopolitics. US Treasury yields touched multi-decade highs in early October, and Houthi attacks on Saudi Arabia revived worries about oil flows from the Gulf.
- Stretched positioning. The index was up as much as 122% for the year at its peak, with heavy retail leverage. In June, regulators admitted that leveraged ETF approvals tied to the two chipmakers had been rushed, which unsettled the market further.
KOSPI price overview since late June
The KOSPI peaked at ₩9,385.59 intraday on 19 June, and its record close came on 22 June at ₩9,114.55. Today’s ₩6,035 is about 36% below that intraday high and 34% below the record close, so “about 35%” is a fair summary. The KOSPI’s year-to-date gain has shrunk from roughly 122% to 43%.
The slide came in violent steps rather than a slow grind:
- 23 June: −9.99% to ₩8,203.84, after regulators admitted the leveraged-ETF mistake.
- 8 July: a 5.35% drop to ₩7,246.79 put the KOSPI more than 20% below its peak, officially a bear market.
- 28 July: −10.84% to ₩6,023.66 as CXMT’s debut revived fears over memory prices. Circuit breakers fired repeatedly in this stretch, including the eighth of the year.
- 29 July: a close at ₩5,663, with a swing low near ₩5,250 on the daily chart.
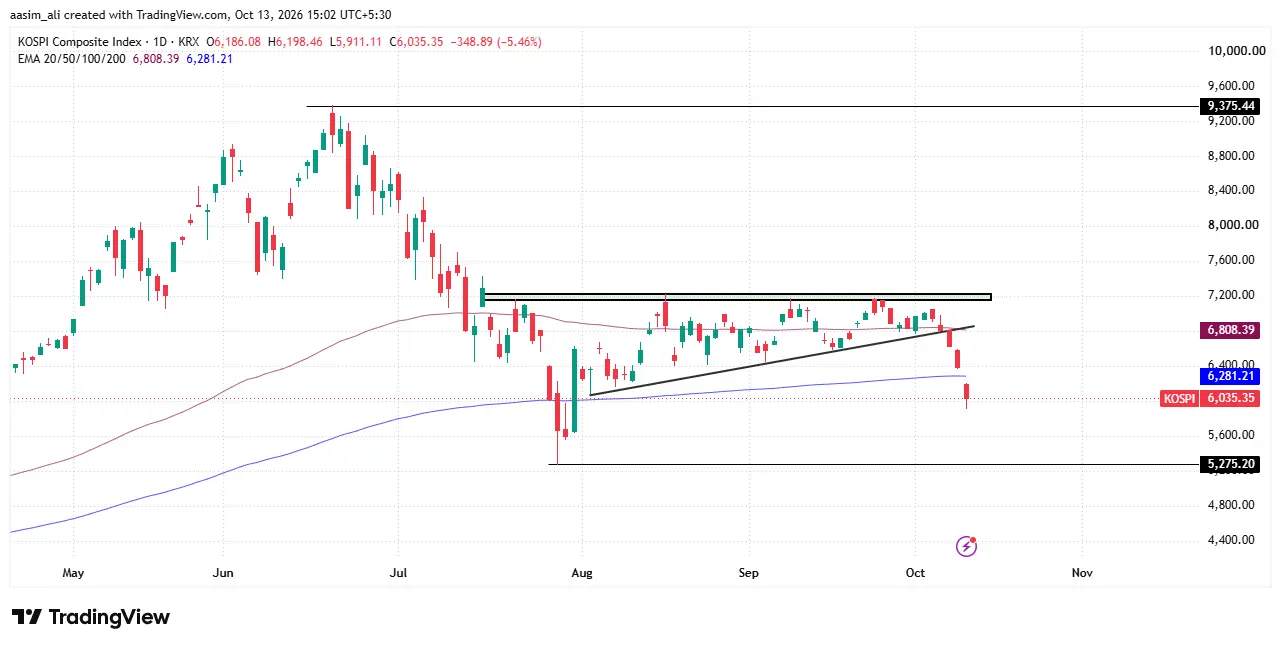
KOSPI price triggered a breakdown from an ascending triangle. What’s next?
After the late-July low, the KOSPI rebuilt in an ascending triangle: a flat ceiling in the ₩7,150-₩7,200 zone and a rising trendline of higher lows starting from the early-August bounce. The ceiling was rejected on repeated tests through August and September, but buyers kept defending higher lows, so the range kept narrowing.
 Source: KOSPI price over 1-D timeframe by TradingView
That structure usually resolves upward. This one formed after a drop of about 44% from the peak (₩9,385 to roughly ₩5,250), so it behaved more like a pause inside a downtrend. In early October the KOSPI closed below the trendline, near ₩6,800, and the sessions after it made lower lows.
A recovery attempt that failed
The first break did not end the move straight away. The KOSPI tried to recover, but the bounce could not reclaim the broken trendline, and sellers pressed again. The close at ₩6,384 on 12 October and the drop to ₩6,035 on 13 October turned a breakdown into a trend: old support became resistance, and each new low came in below the last.
Buyers stepped in; sellers won
The summer followed a repeating pattern. After the late-July capitulation, buyers stepped in and the KOSPI rallied about 37% from the ₩5,250 low to the ₩7,150–₩7,200 zone. Every push into that zone met supply. Retail investors bought the dips aggressively, with a net of ₩3.1 trillion on 7 July alone, but foreign and institutional selling absorbed that demand and the market failed to turn the zone into support.
Key numbers
| Metric | Level |
| Close, 13 Oct (at time of writing) | 6,035.36 points, −5.46% |
| Year to date | +42.82% (from 4,214.17 on 30 Dec 2025) |
| Market capitalization | About ₩4,650 trillion (~$3.4 trillion) |
| 24-hour turnover | About ₩24.4 trillion (~$18 billion) on 12 Oct, roughly 70% below the June peak |
| Past week | −13.8% (from 7,003.74 on 2 Oct) |
| Past month | About −14% |
| Since 22 June record close | −33.8% |
| Past year | About +65% |
| Calendar 2025 | +75.6% |
Dollar values use roughly ₩1,350 per dollar. Market cap and one-month and one-year figures are approximate.
KOSPI’s impact on crypto
The link is real but looser than headlines suggest. Analysts describe it as correlation through a shared investor base and common risk appetite, not direct cause and effect.
- Shared risk-off moves. When the KOSPI fell almost 10% on 23 June, Bitcoin dropped below $63,000, and more than $714 million of crypto positions were liquidated within 24 hours. In the 2 July tech sell-off, AI-linked tokens fell harder than Bitcoin.
- Korean retail liquidity. In late 2025, Korean retail money rotated out of crypto and into chip stocks, and Upbit volumes fell about 80% according to reports at the time. A KOSPI bust can send that money back to crypto, or it can deepen risk aversion across both markets. Analysts have argued both ways.
- No one-to-one link. On 29 July the KOSPI hit back-to-back circuit breakers while Bitcoin rose above $64,000.
For futures traders the practical point is leverage: sharp equity gaps can set off liquidation cascades even when Bitcoin’s own chart has not changed.
Final thoughts
The KOSPI has done what failed triangles tend to do: it lost its trendline and accelerated. The levels to watch below are the ₩5,750–₩5,800 measured-move zone, the ₩5,663 close from 29 July and the ₩5,250 swing low. Above, the broken trendline near ₩6,800 and the ₩7,150-₩7,200 ceiling now cap any rebound.
Three catalysts matter next: Samsung’s preliminary third-quarter results, expected this month; whether foreign selling keeps easing (foreigners had a net-buying day in early October); and further news on CXMT and US yields. Valuation was already low, with a forward P/E near 6.4 in mid-July, which leaves room for a rebound if earnings hold but not if the memory cycle turns.
What is the KOSPI?
The KOSPI (Korea Composite Stock Price Index) tracks the common stocks listed on the main board of the Korea Exchange. It is weighted by market capitalization, and its base value of 100 dates to 4 January 1980.
How far is the KOSPI from its peak?
About 35%. The index peaked at ₩9,385.59 intraday on 19 June and set its record close of ₩9,114.55 on 22 June. It trades near ₩6,035.
Does the KOSPI affect Bitcoin and crypto?
Sometimes. Both react to the same risk appetite, and Bitcoin fell below $63,000 when the KOSPI dropped almost 10% on 23 June. The link is not one-to-one: on 29 July Bitcoin rose while the KOSPI hit circuit breakers.