

The Ethereum price was facing resistance from a level of $2,550 on the daily timeframe. However, buyers tried once and pushed the price out of the zone in mid-September but failed to hold for a longer period. In early October, sellers dominated and pulled the price in this zone again. The Ethereum (ETH) price was trading in this zone and has declined by 3.54% on Monday after facing resistance from the $2,550 level.
What drives Ethereum fundamentals beyond the charts?
Price levels show where ETH may move in the short term, but the fundamentals explain why traders and investors keep watching it.
- Smart contract leadership
Ethereum is the largest smart contract platform. It powers DeFi, NFTs, tokenized assets and thousands of decentralized apps, which keeps real demand for the network alive. - Proof-of-stake security
Since The Merge in 2022, Ethereum has been running on proof-of-stake. Validators lock up ETH to secure the network, which reduces energy use by over 99% and takes a large amount of ETH out of active circulation. - Fee burn and supply dynamics
Under EIP-1559, part of every transaction fee is burned. When network activity is high, more ETH is burned than issued, which can make supply deflationary. When activity is low, supply grows slowly. Either way, ETH supply is far more controlled than before the Merge. - Staking demand
A significant share of ETH is staked, and staking yields give holders a reason to lock up their coins. Spot ETH ETFs and staking products have also widened access for institutions. - Stablecoin and tokenization hub
Most stablecoins and a large share of tokenized real-world assets run on Ethereum. This makes ETH a core part of the on-chain financial system, not just a trading asset. - Layer 2 scaling
Networks like Arbitrum, Base and Optimism process transactions cheaply and settle on Ethereum. This improves scalability while keeping Ethereum’s security. A caveat to mention: L2 growth can also reduce fees paid on the main chain, which affects the burn rate. - Largest developer ecosystem
Ethereum has more active developers and projects than any competing smart contract chain, which supports long-term network effects.
Ethereum price overview
At press time, Ethereum coin was trading at $2,515.98 with an intraday loss of 1.6%. Its market capitalization was $307.251B, and the 24-hour trading volume was $16.646B. Its circulating and total supply is 122.131M ETH.
Ethereum price analysis over 1-D timeframe
The Ethereum price has experienced sharp selling pressure on a daily timeframe on 12th August. However, this fall was almost covered the next day with a V-shaped recovery on the 1-H timeframe.
If the price triggers a breakout from the major resistance level of $2,550, buyers might be confident. If the cumulative volume delta increases during the breakout, a strong bullish rally can be anticipated. Ethereum price could extend to the $2,800 level in the next few weeks.
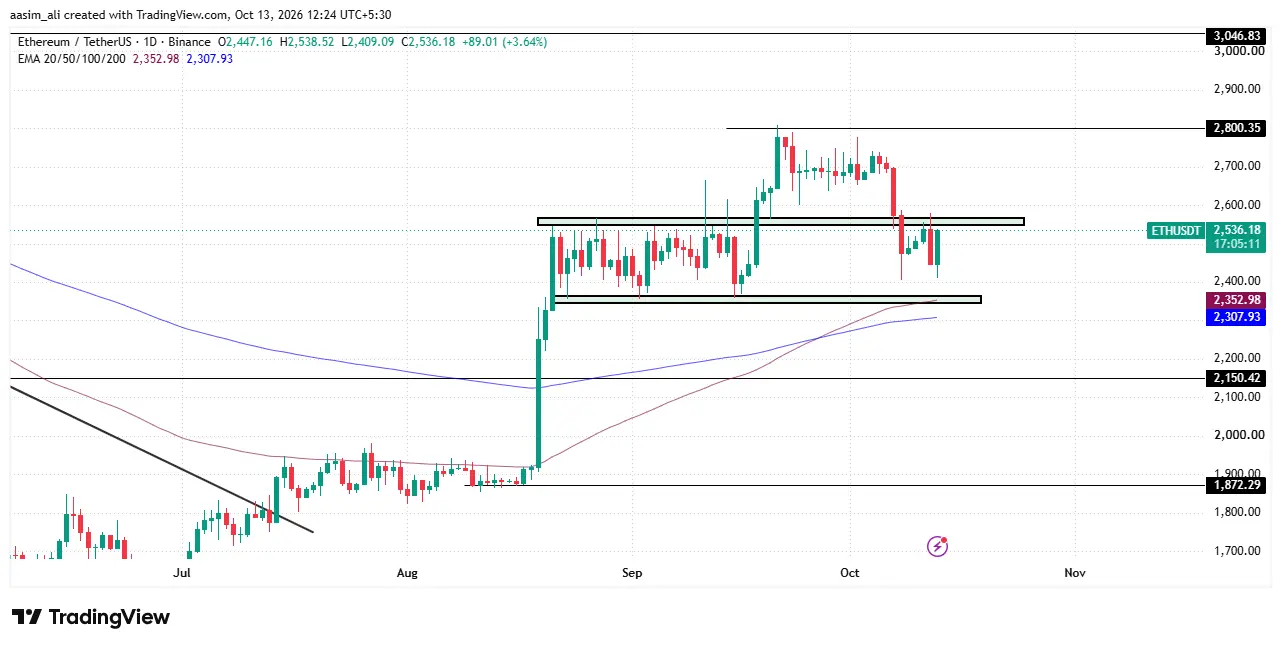
Conversely, if the Ethereum price fails to exceed the $2,550 level, then sellers can drag it down to the immediate support level of $2,360. Once the price slips below the $2,360 level, then buyers might panic. If the price sustains below this level, massive selling pressure can be anticipated.
Ethereum price prediction: Key levels to watch
Ethereum was trading near $2,440 on October 13, after slipping from its early-October highs around $2,720. The drop came with a volume spike near $63B on October 9, which suggests heavy selling pressure rather than a quiet pullback.
The chart shows ETH peaking near $2,780 on September 22, when daily volume hit about $80B, the highest in this period. Since then, the $2,680 to $2,720 zone has acted as strong resistance.
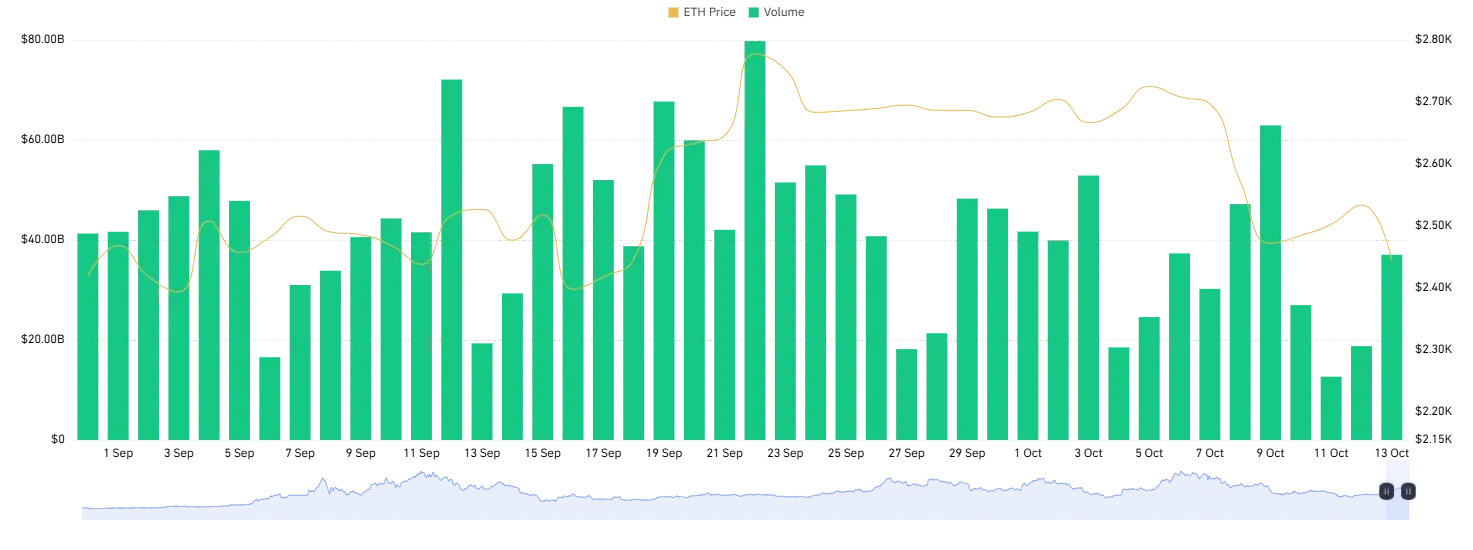
On the downside, $2,400 has been a reliable support level, with Ethereum price bouncing from it in early and mid-September. A break below it could open the way toward $2,300.
Volume has cooled to around $37B, so traders appear cautious. If buyers defend $2,400 and volume recovers, ETH could retest $2,700. If support fails, further downside is likely.
Ethereum price outlook
Price: The bounce reclaimed most of the drop, but $2,570-2,580 (the Oct 12 high) is clear resistance. Support sits at $2,400-$2,420.
Funding: Slightly positive at 0.0055%, so longs are mildly dominant but not overheated. Healthy, not euphoric.
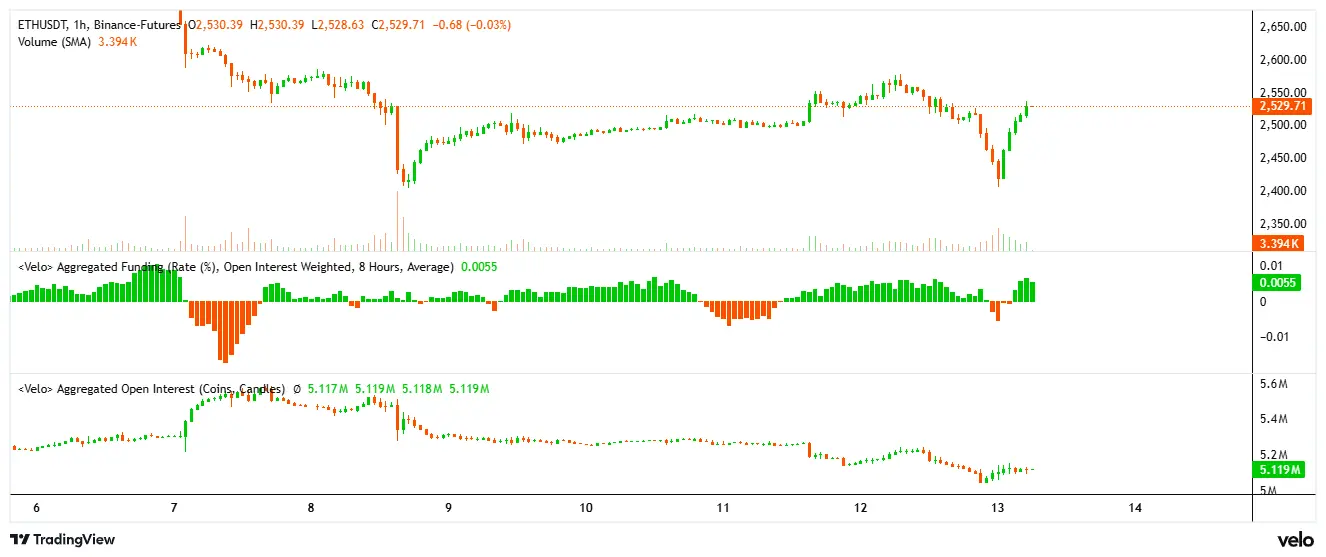
Open Interest: This is the key signal. OI is falling from $5.6M to $5.12M even as price bounces, which suggests the recovery came from short covering and not fresh long conviction.
Prediction: Short-term (24-72 hrs), expect consolidation between $2,470 and $2,580. A clean break above $2,580 with rising OI could target $2,650. Failure to hold $2,470 risks a retest of $2,400.
Final Thought
Ethereum is stuck below a strong resistance zone near $2,550-$2,580, and every push higher has been rejected. The early-October drop came with heavy volume, pointing to real selling pressure. The recent bounce looks weak: open interest is falling while price recovers, which suggests short covering rather than fresh buying, and volume has cooled to around $37B.
Key levels: A clean close above $2,580 with rising open interest and volume could target $2,650, then $2,700-$2,800. On the downside, $2,400-$2,420 is the make-or-break support. Losing it could send ETH toward $2,300.
Short-term view: Expect consolidation between $2,470 and $2,580 over the next 24-72 hours.
Bottom line: The bias stays neutral to cautiously bearish until ETH breaks and holds above $2,580. Wait for confirmation instead of guessing the breakout, and keep risk tight near support.
What is the key resistance level for Ethereum price right now?
Ethereum price is facing strong resistance in the $2,550-$2,580 zone. A clean daily close above $2,580, backed by rising volume and open interest, could open the way to $2,650 and higher.
What is the key support level for ETH?
The $2,400-$2,420 zone is the main support. ETH has bounced from it several times, and a break below it could push the price toward $2,300.
Why is the recent Ethereum bounce considered weak?
Open interest has been falling even as price recovers, which suggests the bounce came from short covering rather than fresh buying. Trading volume has also cooled to around $37B, showing traders are cautious.