

XRP price has gained bullish momentum after a strong bearish trend. It has displayed the strongest week since 2025 and has dominated the key moving averages. That week (17-21 August) was extremely bullish, which recovered a few months’ losses. The price was trading over the key moving averages and change in volume was also spotted. Let’s explore the XRP price forecast.
XRP price overview
At the time of writing, XRP coin was trading at $1.36 with an intraday loss of -2.3%. Its market capitalization is $85.712B and the 24-hour trading volume is $2.089B. Its circulating supply is 62.745B XRP and the total supply is 99.986B XRP while the maximum supply is 100B XRP.
XRP price in a Daily retracement phase: Can it unlock 45% gain soon?
XRP crypto price has witnessed a strong bullish trend on a daily timeframe. Amid this bullish trend, XRP has tapped the swing highs of the previous 200 days. Furthermore, the price has received selling pressure and underwent a retracement phase by losing -10.75% in a week. However, the price has dropped to the 200-days EMA on a daily timeframe.
Suppose buyers manage to defend the 200-days EMA and the chart structure form any bullish candlestick pattern, buyers might show interest. If the trading volume and Open Interest (OI) increases then the trend may continue and the price may gain around 45% to reach the psychological level of $2.
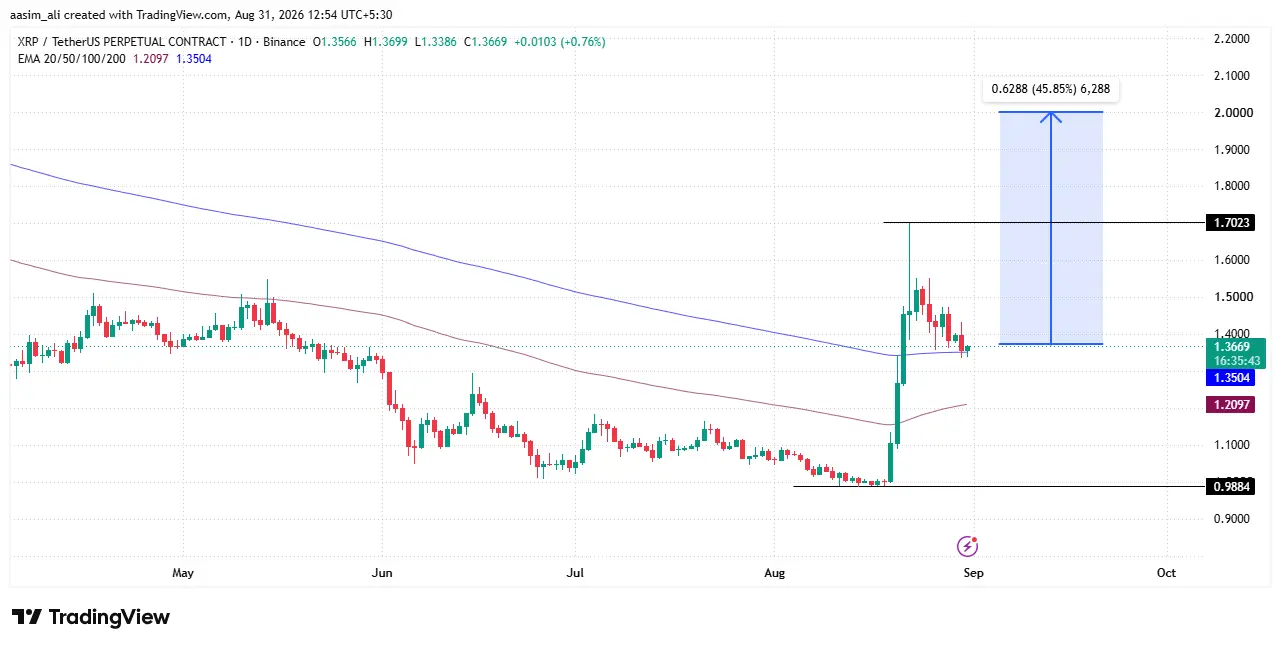 On the other hand, if the XRP coin price slips below the 200-days EMA then buyers might panic. Here, few traders and investors might prefer to book profit which may pull the price to the 100-days EMA. Once the price starts trading below the 100-days EMA, sellers may eye for the $1 mark which is also a psychological zone.
XRP price and volume analysis for August
XRP saw a sharp volume and price surge in the second half of August 2026. For most of the month, trading volume stayed subdued, ranging between $1B and $4B daily, while price hovered in a tight $0.9844–$1.100 band, showing low volatility and limited market interest.
The turning point came around August 19, when volume spiked dramatically to nearly $9B, followed by an even larger surge to over $18B by August 23, the highest bar on the chart in August. This volume explosion coincided with a steep price rally, pushing XRP from roughly $1.00 to a peak near $1.7010 by August 24.
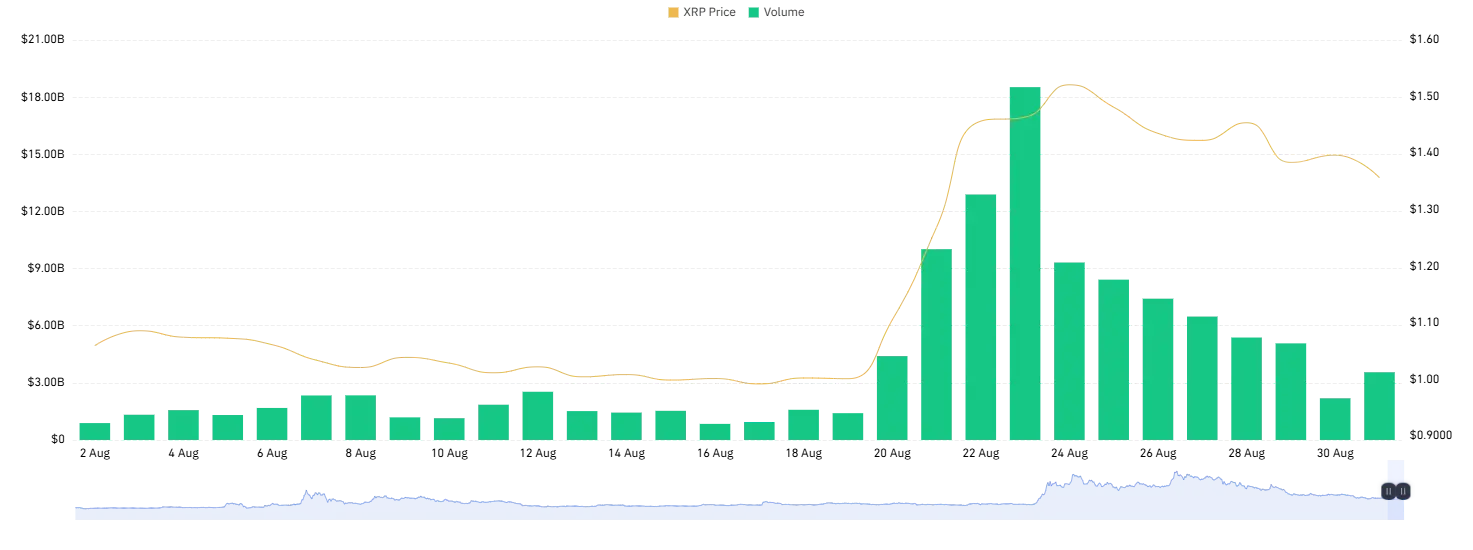
After peaking, both volume and price began cooling off. Volume gradually declined through the following days, and price slipped from its highs to around $1.35–$1.40, suggesting profit-booking after the rally. By August 31, volume ticked up slightly again while price continued trending lower, hinting at possible consolidation ahead.
XRP coin price and Open Interest (OI) analysis
From 31 July to 19 August, XRP’s price stayed range-bound between roughly $0.95 and $1.701 even as Open Interest steadily climbed from around $2.4B to $2.7B, a divergence that typically signals traders quietly building leveraged positions ahead of a move. This changed sharply between 19-22 August, when price surged from about $1.00 to $1.701 while OI simultaneously spiked to a peak of nearly $3.65B by 24 August, confirming that fresh capital (not just short-covering) was driving the rally, a structurally stronger signal than a low-OI pump.
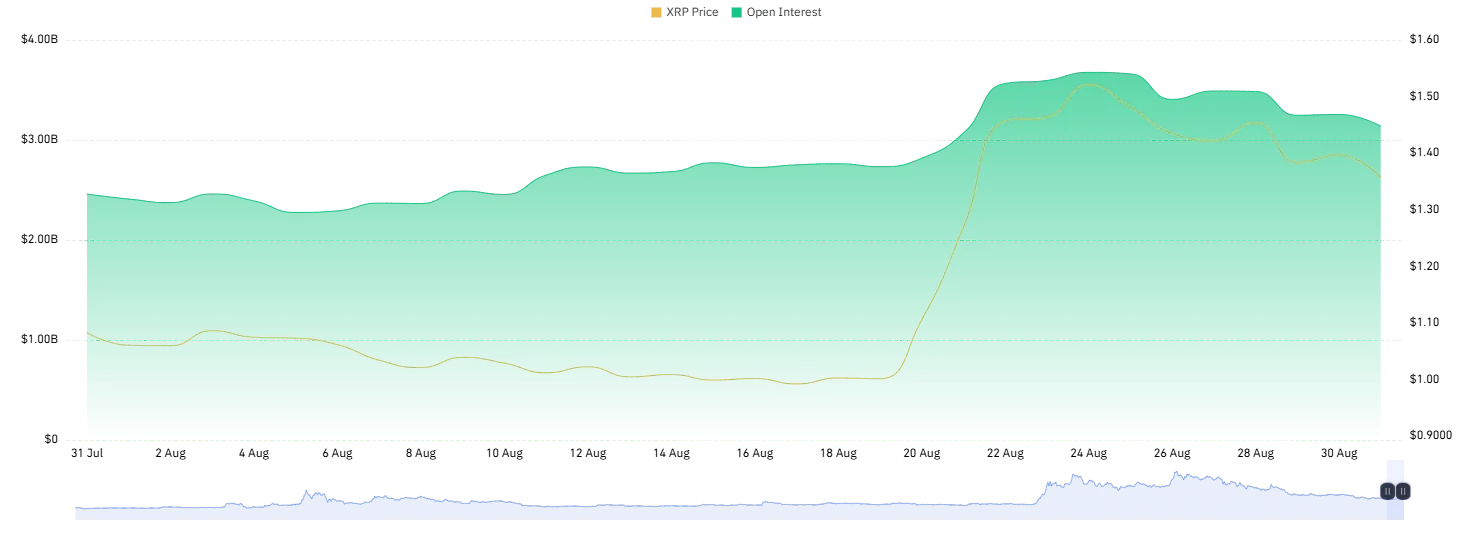 Price topped out near $1.53 around 23-24 August before both price and OI began easing together through 25-30 August, settling near $1.38-$1.40 and $3.1-$3.2B respectively, which suggests long-side profit booking and mild deleveraging rather than aggressive new shorting. For a forecast, this pattern is constructive as long as OI stabilizes: holding above the $1.35-1.40 zone with steady OI would point to healthy consolidation before another leg up, whereas a break below that zone accompanied by further OI decline would indicate unwinding of the rally and open downside risk back toward $1.20.
Final Thoughts
XRP’s price action currently sits at a decisive juncture. The 200-day EMA is acting as the line in the sand: a successful defense here, backed by rising volume and open interest, could set up a run toward the psychological $2 level, a roughly 45% move from current levels. However, a breakdown below this key moving average would likely trigger profit-booking, dragging price toward the 100-day EMA and potentially exposing the $1 support zone.
The late-August volume spike (from sub-$4B days to over $18B) shows that XRP is far from short of market interest; the coin can still attract explosive capital inflows when sentiment turns. The current pullback and cooling volume look more like healthy consolidation after a sharp rally than a reversal of trend, but traders should watch the 200-day EMA closely over the next few sessions. Holding it keeps the bullish structure intact; losing it would shift the near-term bias back toward sellers.