

Tron price has experienced buying pressure on a wider timeframe but underwent a correction phase of around 18%. The chart structure has generated a liquidity sweep scenario and has exceeded the key moving average on a daily timeframe. Amid this movement, the open interest has increased. Let’s explore how these data can impact the TRX price further movement.
Tron (TRX) price overview
At press time, Tron price was trading at $0.3274 with an intraday gain of 1.5%. It has a market capitalization of $31.087B and the 24-hour trading volume is $341.214M. Its circulating supply and total supply is 94.932B TRX. Tron price shows recovery after a decent fall.
Tron price analysis over 1-D timeframe
Tron price has been in a bullish trend from the beginning of 2026 and surged by 15.31% YTD. However, the price has experienced a retracement of 18% but buyers seem to bounce back.
In early June, TRX price experienced selling pressure but buyers managed to take a support of the previous Weekly Swing High and the price reversed from the $0.3084 level. Since then, the asset price has witnessed slow and steady gain. The chart structure displays that the price has grabbed liquidity beneath the 200-days EMA and previous support level of $0.32095 level.
TRX price has surged by 2.18% after the liquidity grab. If institutions’ orders have been triggered in this zone, the price might display a great change for a longer time. Tron price has surpassed the 200-days EMA on a daily timeframe and heading toward the 100-days EMA. If the price exceeds the 100-days EMA and holds, the price might extend to the next resistance zone of $0.34221-$0.3400.
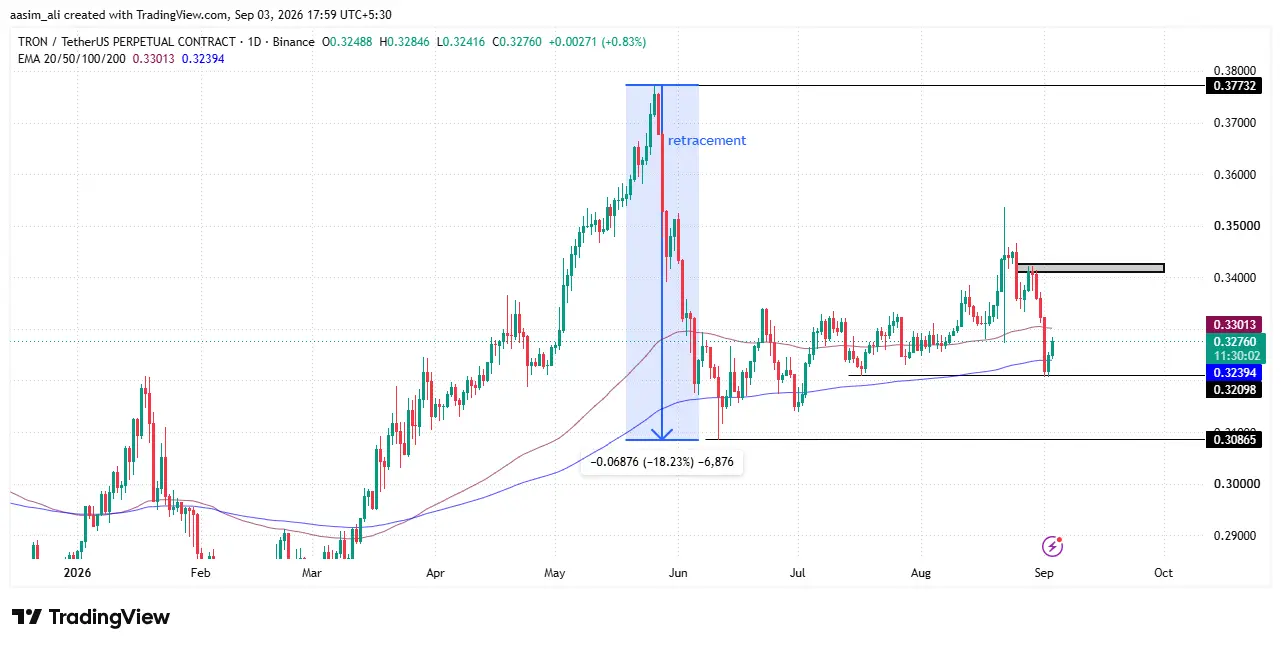
On the other hand, if the Tron price slips below the 200-days EMA and fails to defend the previous support level of $0.32095 then sellers may dominate further. Once the price sustains below this level, strong selling pressure can be anticipated. The other line of defence for TRX coin could be $0.3086 level amid the bearish momentum.
How Bitcoin price movement can impact TRX price?
As we know that Bitcoin is a leading coin and almost all the altcoins follow its footstep. BTC has remained extremely bullish for the past few weeks. It has been consolidating in a narrow zone after the bullish trend.
Profit booking was not seen on a higher level which means institutions and whales are still there. Once the BTC price triggers another rally, a bullish trend for a longer time can be seen and this rally can bring a bullish trend in the crypto market.
This bullish momentum in BTC could impact the Tron price. As per the chart structure, the price was trading over the 200-days EMA which might work as a catalyst to boost the momentum. A further bullish trend in BTC could impact the TRX coin positively and a bullish rally in Tron can be observed.
Tron Open Interest (OI) analysis
TRX’s Open Interest has shown a broadly upward trend between August 6 and September 3, climbing from around $238M to nearly $299M: its highest level in the period. Price, however, has moved somewhat independently of this OI build-up. Early August saw price consolidate near $0.3255 even as OI dipped to around $230M.
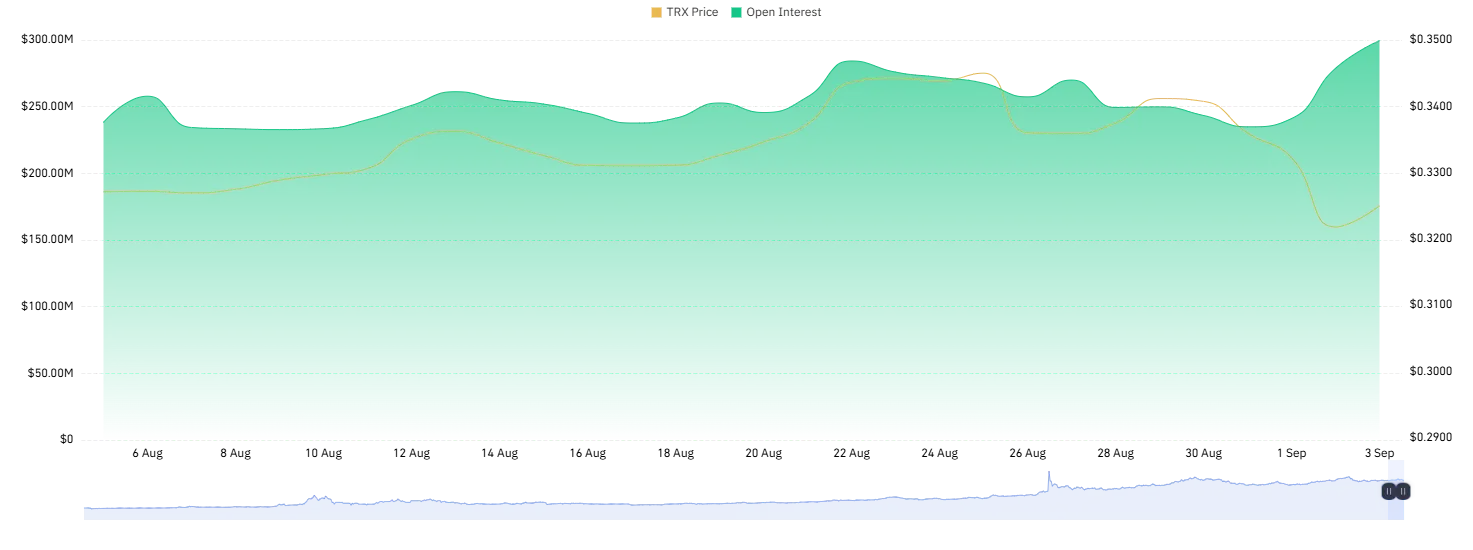
Between August 20–24, OI spiked sharply to a peak of $285M, coinciding with price rallying to its high of $0.34509. A brief pullback in both metrics followed around August 26, before OI recovered again into month-end. The most notable divergence appears in the final stretch (Sep 1–3): OI surged to its period-high of $299M, but price fell sharply to $0.32076, breaking away from the OI uptrend. This kind of rising OI with falling price often signals fresh short positioning building up in TRX futures.
Final thought
Tron’s move above its 200-day EMA looks technically constructive, especially with the liquidity sweep beneath support suggesting stronger buyers may have stepped in during the dip. If price can clear and hold above the 100-day EMA, a push toward $0.3400 looks plausible from here.
That said, the Open Interest divergence seen between September 1-3 is the bigger concern, OI rising while price fell typically signals fresh short positioning building up rather than genuine bullish conviction, meaning this rally attempt could still face a test before it’s confirmed.
The key levels to track are $0.3240 as the line in the sand for bulls, with a break below opening the door to $0.3086, while a sustained move above the 100-day EMA would strengthen the bullish case toward $0.3400. Overall, the structure currently favors buyers, but the OI-price divergence means this breakout needs confirmation rather than blind conviction.
What is the key support level for TRX right now?
The $0.3240 level is the immediate support to watch, as it aligns with the previous liquidity zone. If this fails to hold, the next line of defense sits at $0.3086.
What does the rising Open Interest with falling price mean for TRX?
Between September 1-3, TRX’s Open Interest surged to a period-high of $299M while price fell to $0.32076. This divergence often signals fresh short positioning building up in futures markets, suggesting some traders are betting against the current move.
What is TRX’s next resistance target if the rally continues?
If TRX breaks and holds above the 100-day EMA, the next resistance target is $0.3400.