

Ethereum price has been in a bullish trend on a wider timeframe. ETH price has triggered a breakout from a consolidation phase and has witnessed decent bullish move. The trading volume and OI has also witnessed great change which might impact the ETH coin price. The price was trading over the key moving averages which could be a bullish signal.
Ethereum Fundamentals Supporting the Rally
Beyond the technical breakout, Ethereum’s fundamentals are strengthening in parallel. Binance ETH withdrawals hit a three-year high on September 22, signaling a supply reduction as coins move off exchanges into cold storage or staking. On the institutional side, U.S. spot Ether ETFs pulled in $270 million in net inflows on September 21, reversing a brief outflow streak, with BlackRock’s iShares Ethereum Trust (ETHA) leading at roughly $110 million, about 41% of the day’s total.
Ethereum ETF inflows reached roughly $1.75 billion in August 2026 and stayed positive into September, marking one of the strongest institutional accumulation phases of the year. Analysts also point to Ethereum’s staking-enabled ETF wrappers as a structural demand driver, since they offer yield that plain spot exposure cannot match. Together, falling exchange supply and rising institutional flows reinforce the bullish technical setup, suggesting the current breakout is backed by genuine capital inflow rather than short-term leverage.
Ethereum price overview
At press time, Ethereum price was trading at $2,770.21 with an intraday gain of 1.71%. Its market capitalization was $339.062B and the 24-hour trading volume was $16.098B. It has a circulating and total supply of 122.073M ETH.
Ethereum price analysis over 1-D timeframe
Ethereum price has been in a strong bullish trend and has surged by 76% since July. Amid this bullish trend, the price has surpassed the 200-days EMA on a daily timeframe. The price has surged by 15% in a week which showcases buyers’ dominance.
According to the chart structure, buyers’ seems to be stronger and can extend to the $3,000 territory in a single push. Once the price reaches the $3,000 territory and holds then OI can increase. Additionally, if OI increases then another rally of around 20% can be observed and the price could extend to the next resistance level of $3,400.
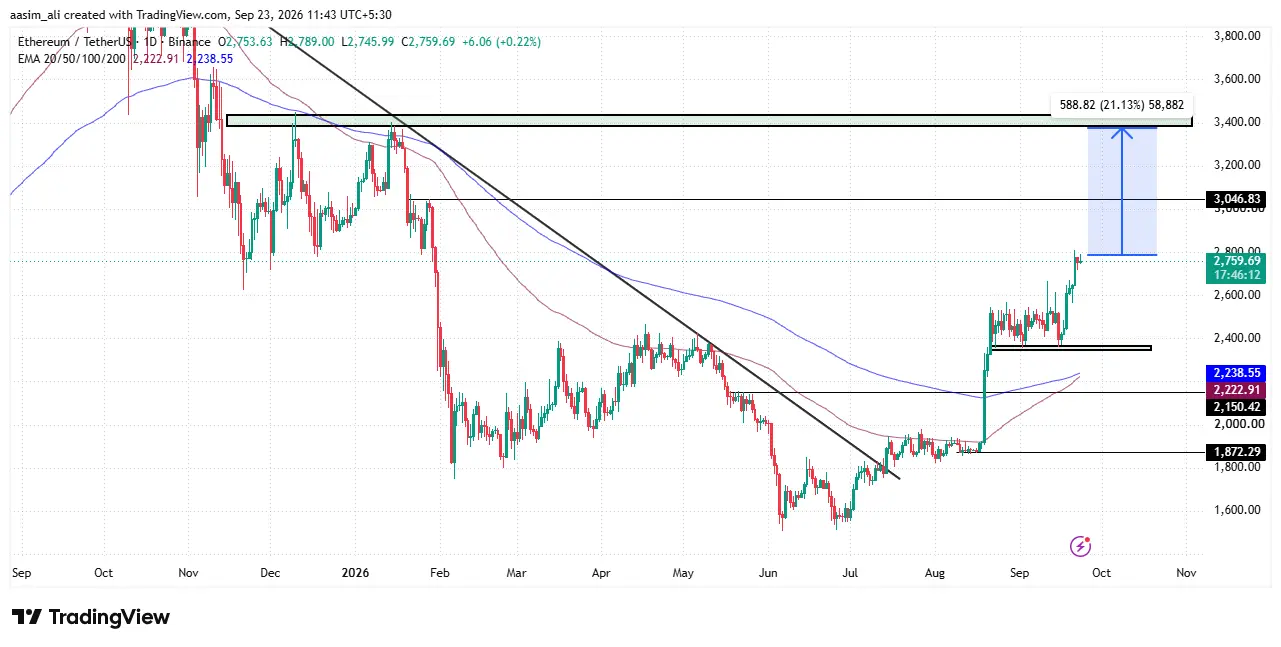
Conversely, if buyers lose the control then profit booking might be expected. Ethereum price could undergo a correction phase due to the profit booking. If the profit booking increases then the price could drop to a strong support level of $2,350.00.
Ethereum price and volume analysis
Momentum picked up again from mid-September, with price pushing past $2,800 alongside a fresh volume spike near September 22-23 ($80B), suggesting renewed buyer interest heading into the final week. If Ethereum sustains its current structure, the $2,550 zone, the breakout level from August, is likely to act as strong support on any pullback. As long as ETH holds above this level, the broader trend remains bullish, with the next resistance zone likely near $2,900–$3,000, a psychological and historical barrier for ETH. The renewed volume spike in late September indicates fresh capital entering the market rather than exhausted momentum, which is generally a positive signal for continuation.
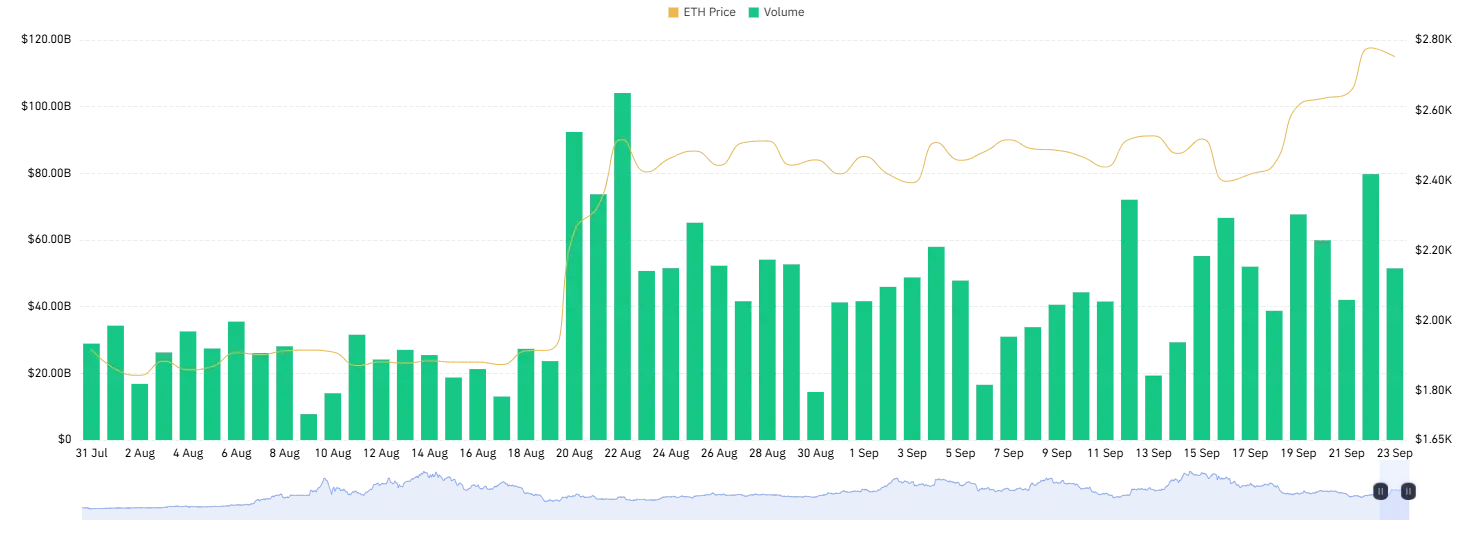
However, if ETH slips back below $2,500 with high volume, it could signal a deeper correction toward the $2,300 consolidation zone. Given the pattern of volume-led breakouts followed by consolidation, ETH may see one more retest before attempting a move toward $3,000 in the near term. As always, this is a technical read of the chart, not financial advice, traders should factor in broader market conditions before acting.
Ethereum price and Open Interest (OI) Analysis
Based on the chart, Ethereum’s price and Open Interest have been rising in tandem since late August, a pattern that typically points to genuine, demand-driven momentum rather than a short-lived, leverage-fueled spike. The most recent leg between September 19 and 23 is particularly telling: ETH surged from around $2,400 to nearly $2,750 while Open Interest expanded from roughly $33B to $38B, showing that fresh capital is actively backing the rally rather than traders simply closing out old positions.
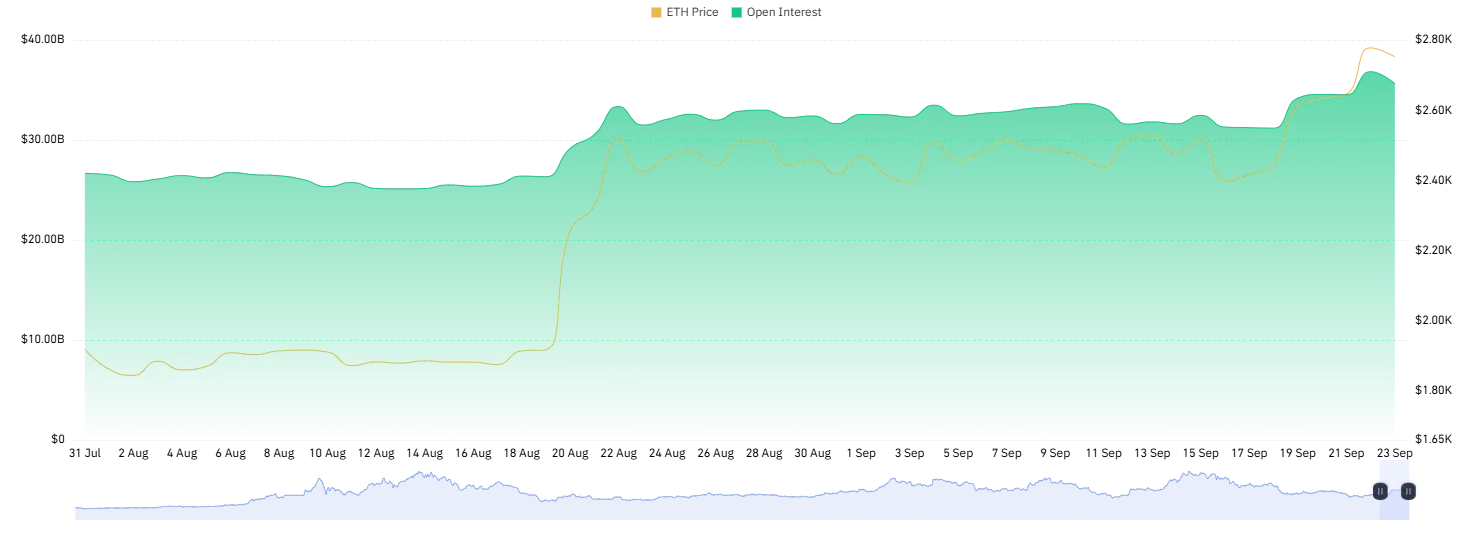
As long as Open Interest continues climbing alongside price, ETH looks positioned to push toward the $2,850–$3,000 zone in the near term, with $3,000 acting as the next psychological resistance level. However, if Open Interest starts declining while price stalls or reverses, it would suggest the rally is losing steam and could open the door to a pullback toward the $2,550–$2,600 support zone, where the previous consolidation phase held firm.
Final Thoughts
Ethereum’s breakout from its consolidation zone looks technically sound, backed by rising Open Interest, a fresh volume spike, and price holding firmly above key moving averages. The fundamental picture adds further weight to the bullish case, falling exchange supply, resumed ETF inflows, and growing institutional interest in staking-enabled products all point to demand-driven momentum rather than a leverage-fueled spike.
If Ethereum price holds above the $2,550–$2,600 support zone, a push toward $2,900–$3,000 looks likely, with $3,400 in sight if that level breaks with conviction. That said, the setup isn’t without risk. A drop below $2,500 on high volume could quickly shift sentiment and open the door to a retest of the $2,300 zone.
Why is Ethereum price rallying right now?
Ethereum price has broken out of a consolidation phase on strong volume and rising Open Interest, signaling fresh capital entering the market. This technical breakout is supported by fundamentals like resumed ETF inflows and falling exchange supply.
What is the next resistance level for Ethereum?
The immediate resistance sits near $2,900–$3,000, a key psychological and historical barrier. A sustained break above this zone could open the path toward $3,400.
What support level should traders watch?
The $2,550–$2,600 zone is critical, as it marks the August breakout level. As long as Ethereum price holds above this, the broader trend stays bullish. A drop below $2,500 could trigger a deeper correction toward $2,300.