

The Ethereum price has been in a bullish trend and has surged by more than 30% since August. Amid this bullish trend, the Ethereum price has surpassed the key moving averages on a daily timeframe. Great changes in OI, funding rate, and volume were spotted. Let’s connect the dots and make a view on the further price movement.
Fundamentals we should know about Ethereum
- Spot ETH ETF flows
This is the strongest current fundamental catalyst. Spot Ethereum ETFs ran 12 straight days of inflows, pulling $1.62 billion total, with BlackRock’s ETHA taking $148.8 million on September 11 alone, its best single-day haul since January. You could contrast this with Bitcoin ETF weakness: spot ETH ETFs saw $197M in inflows in the week ending September 11, while Bitcoin funds bled $463M, framing it as capital rotating from BTC into ETH. - Staking-enabled ETFs (the “yield” narrative)
This is a big 2026 structural story. SEC guidance in May 2026 carved out validator rewards as distinct from profit distributions, opening the door to staking-enabled ETF products, which turns ETH exposure from a pure price-return vehicle into a yield-generating instrument institutions can more easily model. This gives allocators a “yield story” they understand, similar to dividends or coupons. - Supply squeeze / staking as a supply sink
Every ETH locked in staking is effectively removed from liquid circulating supply, creating a structural supply sink that grows over time, and combined with the fee-burn mechanism, rising staking participation shrinks the effective tradeable float even as institutional ETF demand builds. You mentioned OI and funding already, this ties the fundamental supply side to your technical squeeze narrative. - Validator/staking stats
Concrete numbers you can cite: native staking APR has compressed to around 2.78% across roughly 897,000 active validators, with total staked ETH at 38.9 million, about 32% of supply. - Upcoming network upgrade (Glamsterdam)
The Glamsterdam upgrade is positioned as Ethereum’s next big catalyst, if it ships on schedule and performs as designed, it strengthens the network’s fundamentals by lowering transaction costs and expanding throughput. Good forward-looking hook to close the article on. - Regulatory tailwind
A revised Senate bill (Clarity Act) with White House-backed concessions boosted regulatory optimism on September 14, worth a line since regulatory clarity is often what unlocks institutional flows.
Bitmine Immersion Technologies
Bitmine, chaired by Tom Lee, announced on September 14 that its ETH holdings reached 5.96 million tokens (worth $15.8 billion including cash and other holdings), valued at $2,513 per ETH. This makes Bitmine the holder of about 4.9% of Ethereum’s total supply, putting it 98% of the way to its self-set “Alchemy of 5%” target in just 15 months.
A few specific data points worth citing:
- Staking scale: Bitmine had over 5.07 million ETH staked as of September 13, calling itself the largest staker of ETH globally, via MAVAN (Made in America VAlidator Network). At scale, this is projected to generate roughly $392 million in annualized staking revenue at a 2.62% yield.
- Relative performance framing: The company noted ETH was the best-performing macro asset in Q3 2026 to date, outperforming the S&P 500 by 5,866 basis points.
- Institutional backing: Bitmine counts Cathie Wood’s ARK, Founders Fund, Bill Miller III, Pantera, Kraken, DCG, and Galaxy Digital among its institutional investors, adding credibility to the corporate-treasury narrative around ETH, similar to how MicroStrategy became a proxy for BTC.
Ethereum (ETH) Price Overview
At press time, Ethereum price was trading at $2,481.72 with an intraday loss of 1.3%. Its market capitalization was $302.886B and the 24-hour trading volume was $16.179B. It has a circulating and total supply of 122.05M ETH.
Ethereum price formed an Ascending Triangle Pattern: What’s next?
Ethereum price chart has displayed a bullish trend and has increased by 33% since August. This bullish trend was halted near the $2,565 level and the price started consolidating. Amid this consolidating, the price has formed an ascending triangle pattern on a daily timeframe.
On September 11, buyers tried to continue the trend but sellers were strong enough and dragged down the price below the $2,560 level. If Ethereum price triggers a breakout from this level and closes over this level on a daily timeframe, buyers might be stronger. If the trading volume and IO increase while the breakout, massive buying pressure can be anticipated. This bullish trend can continue to the $3,000 level.
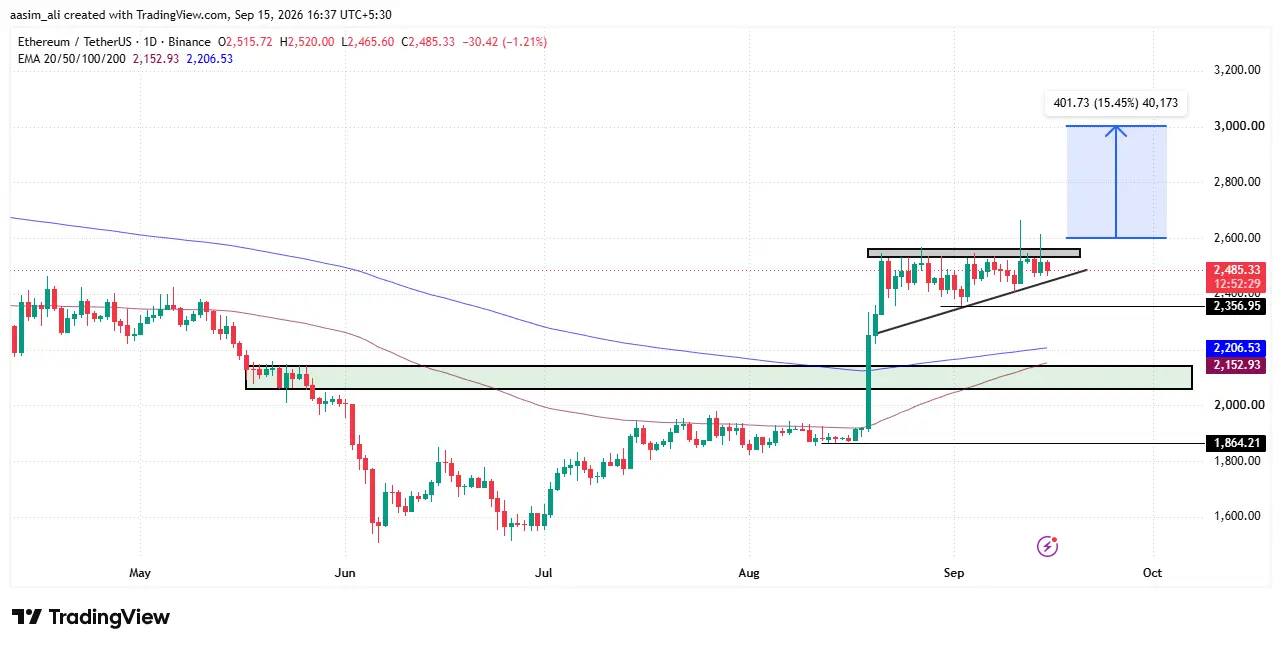
On the other hand, if the Ethereum price triggers a breakdown from this triangle then buyers might panic. Once Ethereum price starts trading below the $2,356 level, profit booking can be observed. Amid this bearish trend, the price might slip to the $2,100 zone.
Ethereum price, Open Interest (OI) and Funding Rate Analysis
- Price: Ranged roughly $2433–$2666 over the period. After spiking to the $2666 high early on, price sold off to a low of $2433, then recovered in a choppy uptrend, retested $2555 highs, pulled back, and now sits near $2474 (+0.06% on the last candle).
- Open Interest: Spiked sharply alongside the initial volatility (13.9–15B+), then steadily declined as price fell, suggesting long liquidations/de-leveraging. OI has since stabilized and ticked up slightly with the recent price recovery, now at 13.87B.
- Funding Rate: Stayed positive (longs paying shorts) for most of the window, peaked around the price rally toward $2555, then turned negative recently (-0.0034%), a shift toward short dominance.
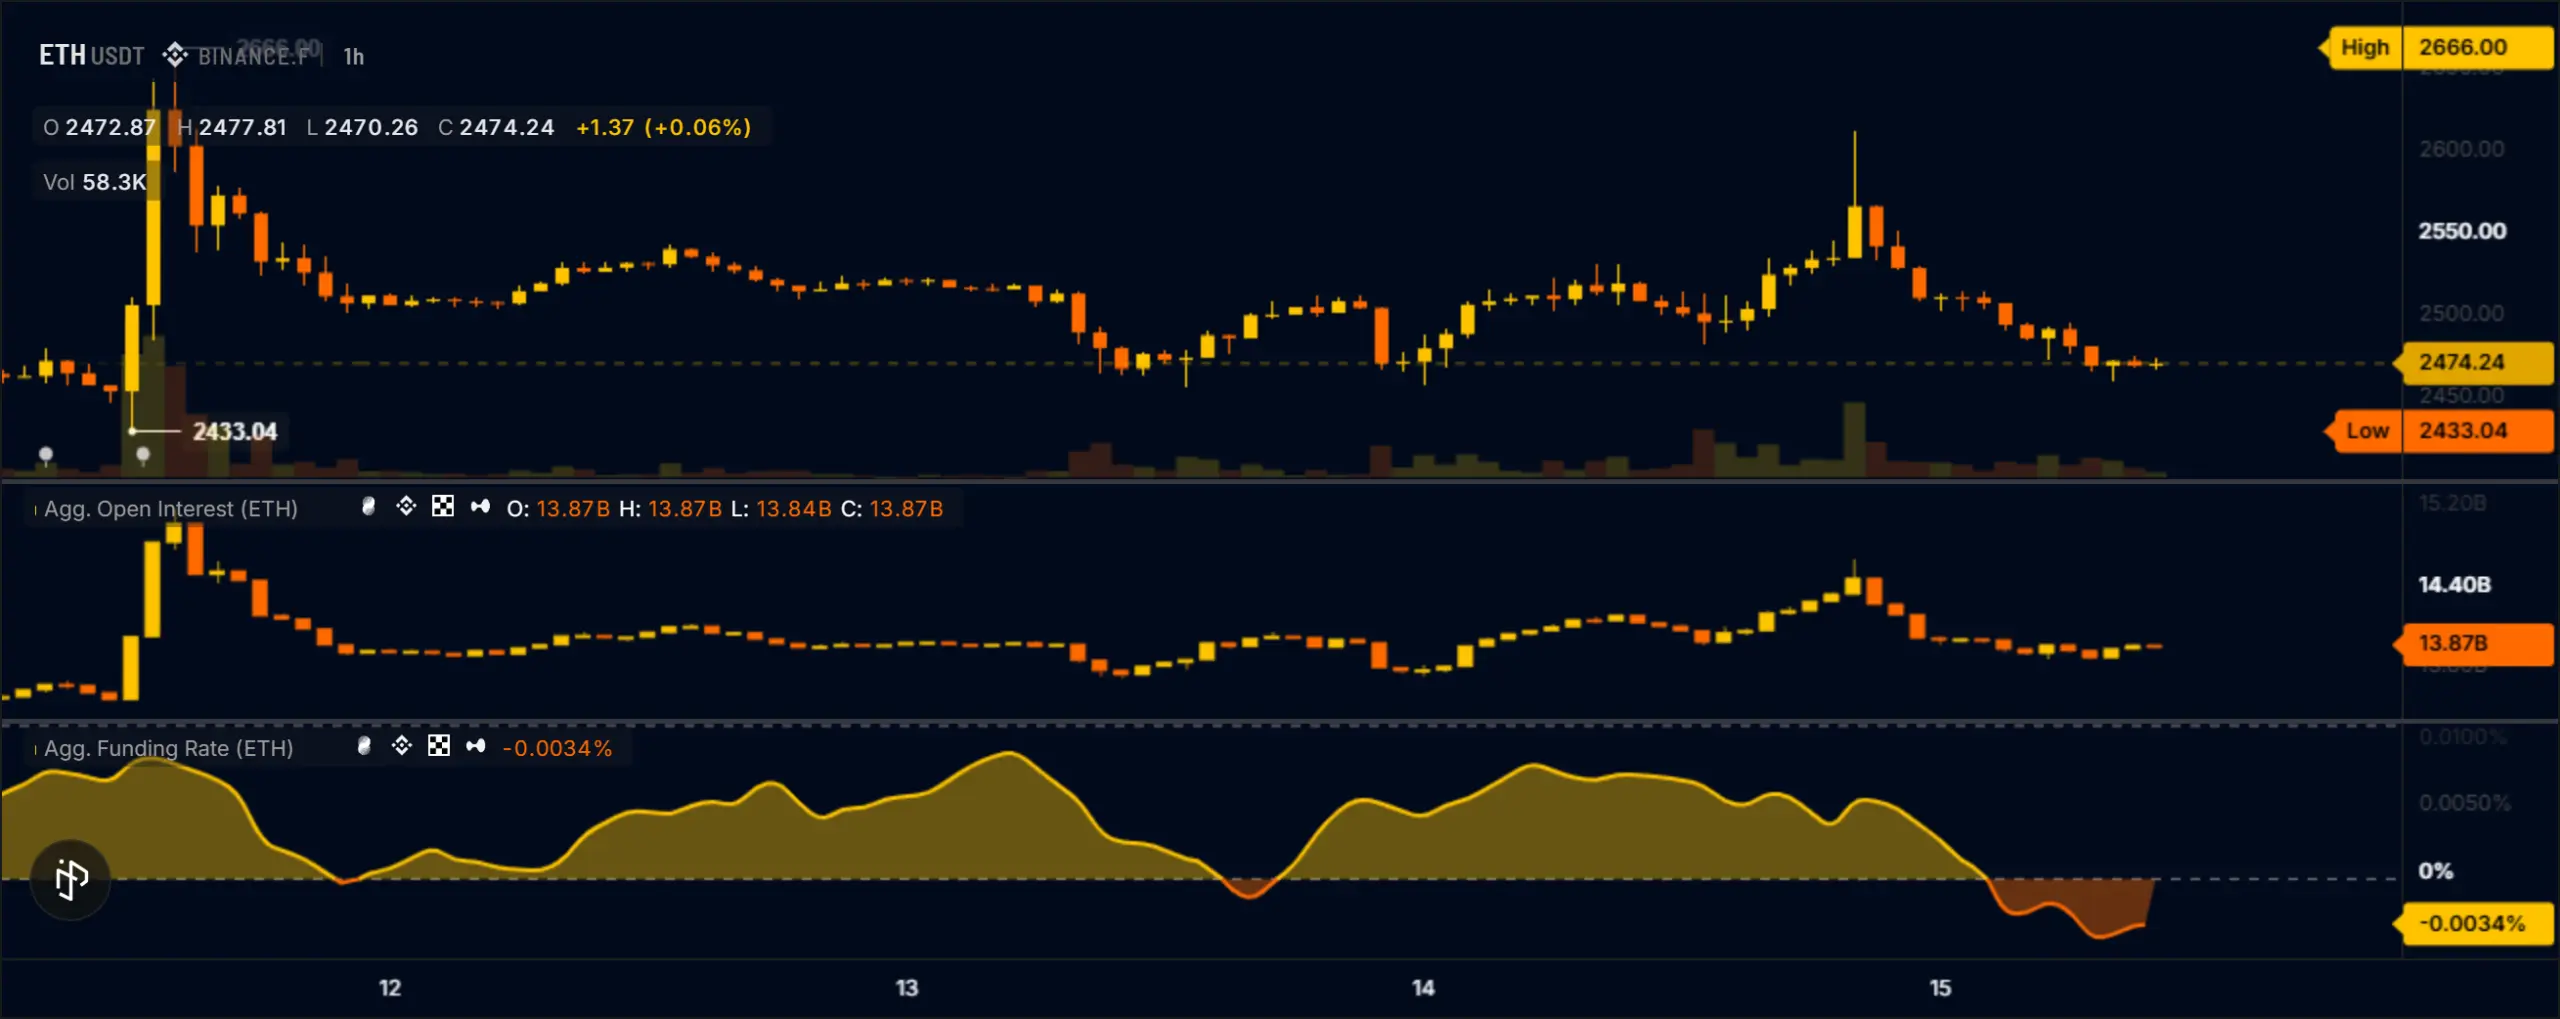
The mix of falling OI + turning-negative funding after a rejection from highs points to fading bullish conviction and possible near-term consolidation or mild downside before fresh positioning builds.
Ethereum Price & Volume Analysis
Ethereum price held steady around $1,800–$1,950 through early-mid August, then broke out sharply around 20 Aug, jumping to $2,360 within two days, accompanied by a massive volume spike ($95–105B, nearly 3x the prior daily average). This volume-price surge signals a strong buying event, likely triggered by a major catalyst (news, ETF flow, or macro trigger).
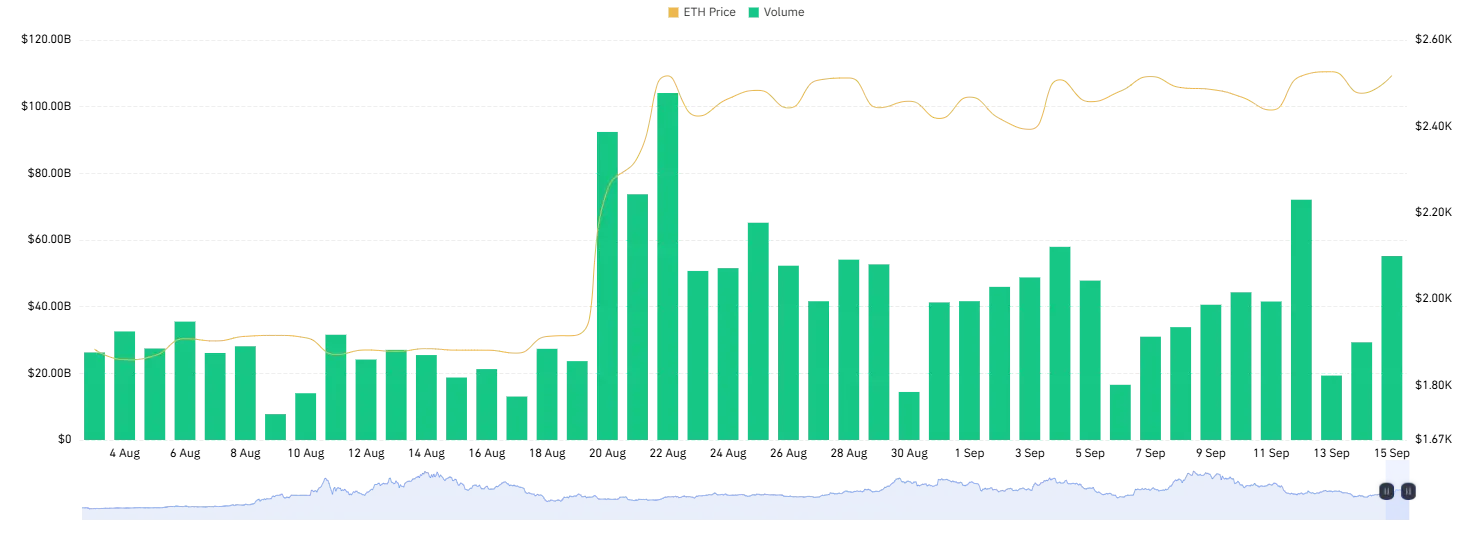
Post-spike, Ethereum price has consolidated in a $2,350–$2,500 range through September, with volume settling into a healthier $30–55B band, a sign of distribution/accumulation rather than panic.
Forecast: The current pattern (higher lows, contained volatility, sustained volume above pre-breakout levels) suggests a bullish consolidation phase. If $2.35K support holds, Ethereum price could retest $2,550–$2,600 in the near term. A break below $2,300 would weaken this outlook.
Final Thought
Ethereum price action reflects a market at an inflection point. The ascending triangle on the daily chart, the moderating volume after the August surge, and the recent flip to negative funding rates all point to the same story: bulls pushed hard, got rejected near $2,565, and the market is now pausing to reset before its next real move.
The $2,560 level remains the line in the sand. A daily close above it, backed by rising open interest and volume, would validate the triangle breakout and open the path toward $3,000. But traders should watch for confirmation rather than chasing the level, the recent OI decline and negative funding suggest conviction has cooled, and a false breakout is a real risk in the near term.
On the flip side, a slip below $2,356 would flip the near-term structure bearish, with $2,100 as the next zone where buyers are likely to step back in.
What is the key resistance level for Ethereum right now?
Ethereum’s key resistance sits at the $2,560 level. A daily close above this zone could confirm the ascending triangle breakout and open the path toward $3,000.
What happens if Ethereum breaks down instead of breaking out?
If Ethereum price slips below the $2,356 support level, profit booking could accelerate, potentially dragging the price down to the $2,100 zone.
What do the Open Interest and Funding Rate data suggest about the current trend?
Open Interest has declined after an initial spike, and the funding rate has turned negative, indicating fading bullish conviction and possible near-term consolidation rather than an immediate rally.