

Ethereum has displayed its strongest week of 2026 and has reached the $2,500 level. This bullish momentum came after the ETH price took support on a major support in the $1,500 zone. Buyers showed confidence and dominated since late June. The Ethereum price has reached the key moving averages and is hovering nearby. Let’s explore how the ETH price could react in further weeks.
Ethereum (ETH) price overview
At press time, ETH was trading at $2,440.24 with an intraday loss of -1.9%. It has a market capitalization of $295.541B, and the 24-hour trading volume is $13.538B. It has a circulating and total supply of 120.681M ETH.
The Ethereum price has touched the $2,500 mark: Can it continue the bullish trend?
The ETH price has displayed strong buying pressure on a major support level of $1,500.00 on the weekly timeframe. Ethereum price has respected this support level four times since 2023. The price has taken support on this major support level after a strong selling pressure. After taking support, the price has surged by more than 55% and reached the 200-day EMA amid this bullish momentum.
Ethereum price has reclaimed the $2,500.00 territory and is staying in this zone. If the price triggers a breakout from the 200-EMA, then buyers might show interest. Once the ETH price manages to sustain over the 200-day EMA, the trend can extend to the $3,000.00 territory soon.
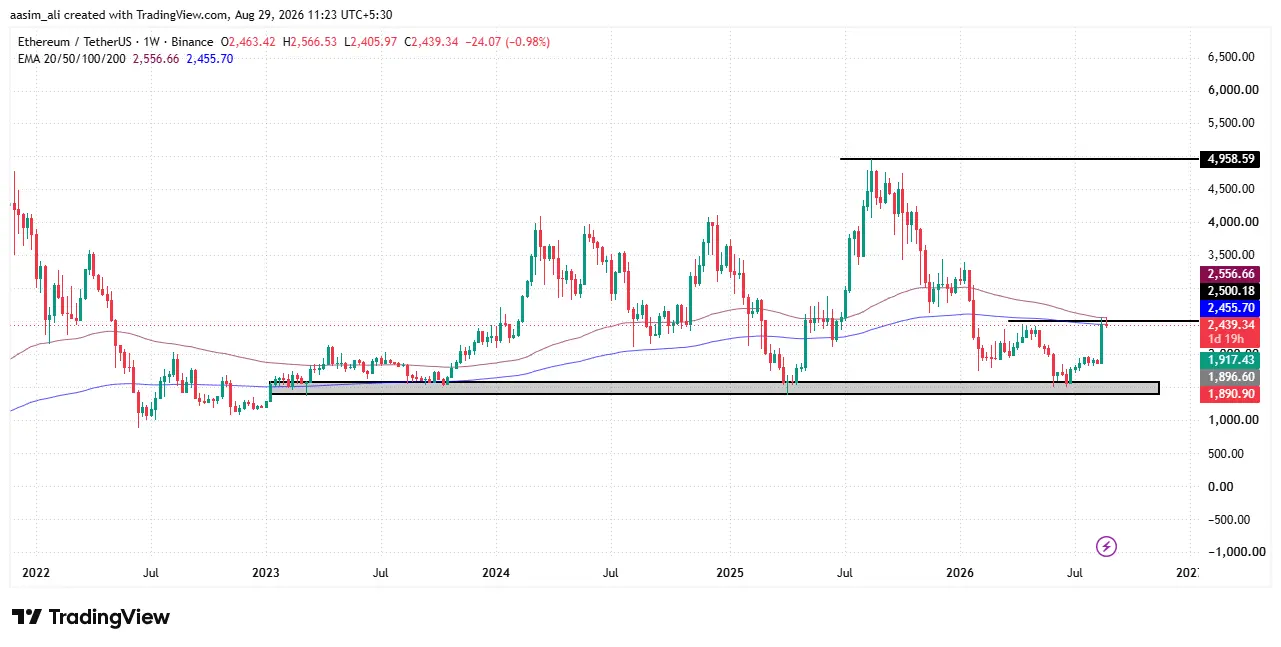
Conversely, if the price faces resistance from the 200-day EMA and forms any bearish candlestick pattern, sellers could hold the grip. The chart structure suggests that the current movement has grabbed the liquidity (short) from the previous high, which could lead to a bearish trend.
Suppose the price drops to the major support level of $1,500.00; then buyers and sellers would struggle for their domination. If sellers win and pull the price below this support level, strong selling pressure can be seen. On the other hand, if buyers manage to defend this support level, then the ETH price might trigger a bullish rally.
Ethereum price and Open Interest (OI) data analysis
Between June 24 and August 29, Ethereum’s price and open interest (OI) show a clear bullish alignment, which is typically read as a healthy, well-supported rally rather than a speculative spike.
ETH began the period trading around $1,650, dipped briefly to roughly $1,515 in late June, then climbed steadily through July to settle in the $1,570–$1,970 range, where it consolidated for nearly a month. The real move came around August 19–20, when price broke out sharply from $1,825 to above $2,500 in just a few days, a gain of over 30% in a short window. It has since traded in a tighter $2,400–$2,550 band through the end of August.
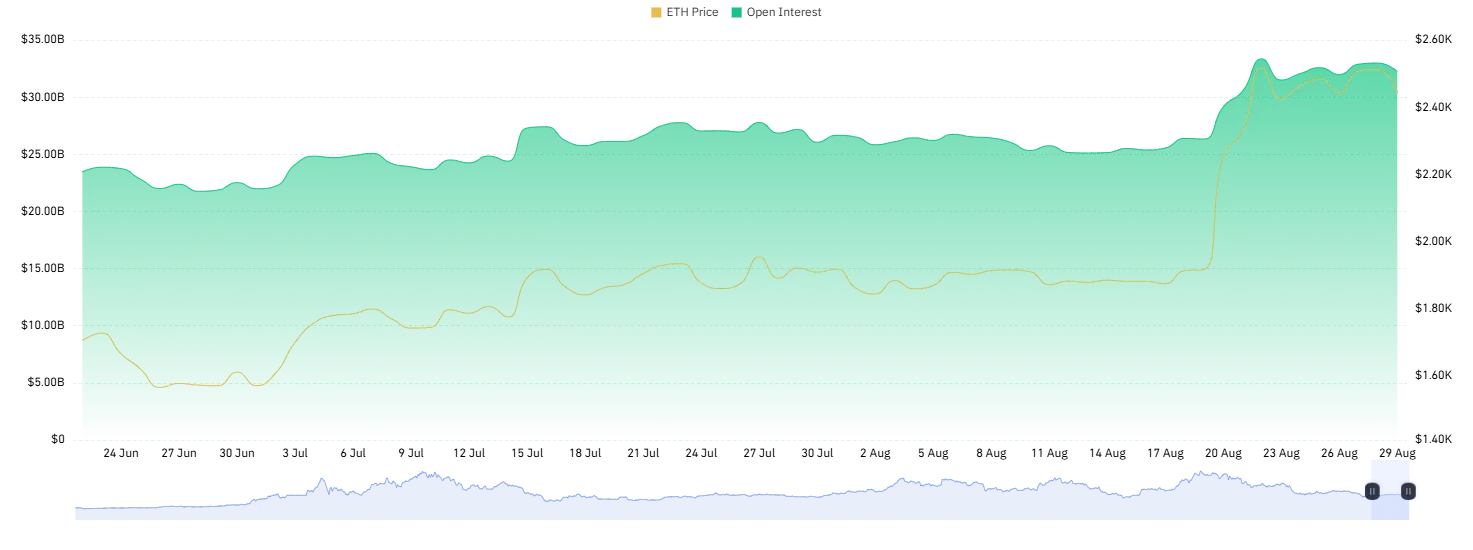
Open interest tells a complementary story. It hovered between $22B and $27B through most of June, July, and early August, moving in a relatively tight range even as price consolidated. When ETH broke out in mid-August, OI surged in tandem, jumping from roughly $26B to a peak near $33.34B, the highest level in the entire three-month window.
This simultaneous rise in both price and open interest suggests the rally was driven by fresh capital and new leveraged positions entering the market, rather than short covering alone, a pattern traders often view as confirmation of genuine bullish conviction rather than a low-liquidity spike.
Ethereum price and volume analysis
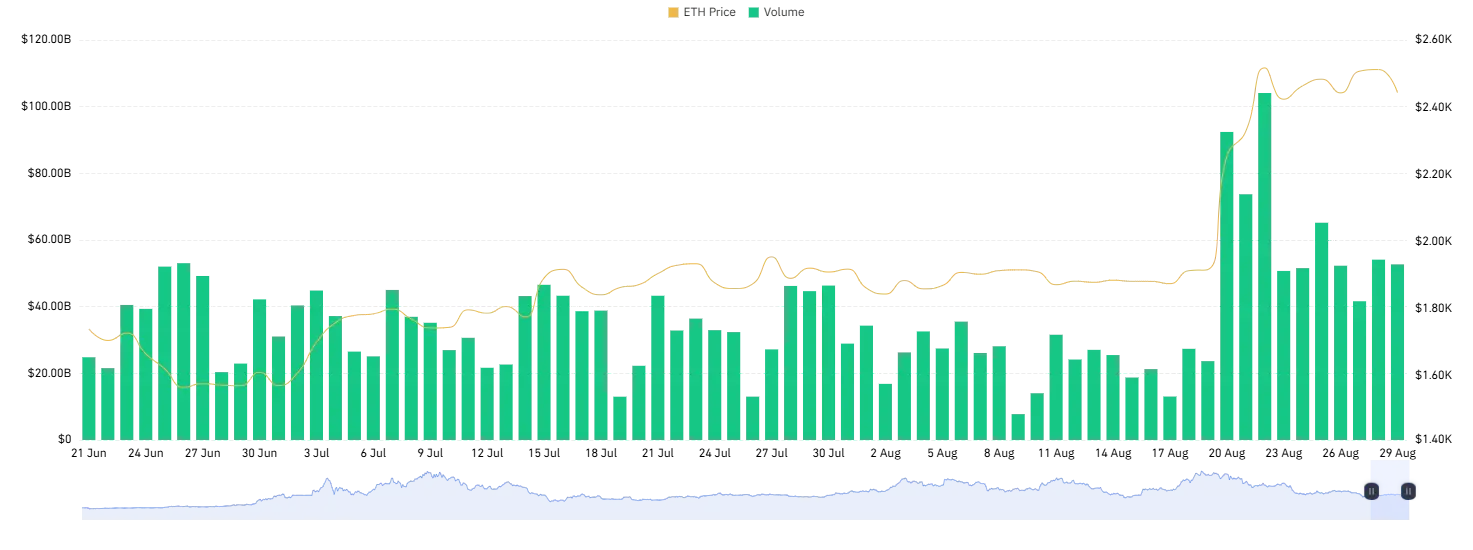
Price trend: ETH moved in a tight range between roughly $1,550 and $1,850 from late June through mid-August, showing consolidation with no strong directional bias. Then around 17–20 August, the price broke out sharply, rallying from $1,850 to over $2,450 within days, and has since been holding in the $2,350–$2,500 zone.
Volume trend: Daily volume mostly hovered between $15B and $50B during the consolidation phase, with a spike near $45–48B around mid-July. The most striking feature is the volume explosion around 20–23 August, hitting $90B–$105B, nearly double the average of prior weeks, coinciding exactly with the price breakout.
How this impacts price going forward:
- Volume confirms the breakout: A price surge backed by 2-3x normal volume signals genuine buying conviction, not a low-liquidity spike, making the move more likely to sustain.
- Post-breakout volume cooling: (down to $40–55B after 23 Aug) while price holds gains suggests consolidation/accumulation rather than reversal, often bullish if it continues sideways rather than dropping.
- Watch for volume divergence: If price stays flat or rises further while volume keeps declining, it could signal weakening momentum and potential pullback.
- This pattern (range-bound → volume spike → breakout → volume normalization) is a classic accumulation-to-markup transition, often preceding further upside if support holds above $2,300.
Final Thought
Ethereum’s move to $2,500 checks the boxes technical analysts look for in a healthy rally rather than a speculative blow-off: price and open interest rose together, volume surged well above average during the breakout, and the advance followed a clean bounce off a support level ($1,500) that has held four times since 2023. The post-breakout cooldown in volume, with price still holding the $2,400–$2,550 range, points to consolidation rather than distribution, typically a bullish sign if it continues.
That said, the setup is at a genuine inflection point. The 200-day EMA is now the line in the sand: a sustained close above it could open the path toward $3,000, while rejection here, especially paired with a bearish candlestick pattern, risks a pullback toward the $1,500 support, where buyers and sellers would likely fight for control again. Traders should also keep an eye on volume divergence: if price grinds higher (or sideways) while volume keeps fading, that would undercut the bullish case built over the past two months.
In short, the structure favors buyers for now, but confirmation, not assumption, should guide the next move. A decisive break of the 200-day EMA on strong volume would be the clearest signal that $3,000 is next on the table.
Why did Ethereum’s price surge 30% to $2,500?
The rally followed a strong bounce off the $1,500 support zone, a level ETH has respected four times since 2023. The breakout was backed by rising open interest (from $26B to $33.34B) and a volume explosion to $90B–$105B, signaling fresh capital and genuine buying conviction rather than a short-covering spike.
What is the key level to watch for Ethereum now?
The 200-day EMA is the critical level. If ETH sustains a breakout above it, the trend could extend toward $3,000. If price faces rejection here with a bearish candlestick pattern, sellers could regain control and push price back toward the $2,000 mark.
Does rising open interest alongside price mean the rally is sustainable?
Yes, this combination is typically viewed as bullish. When price and open interest rise together, it suggests new leveraged positions and fresh capital are entering the market, a healthier signal than a rally driven purely by short covering, which tends to be less durable.