

Ethereum just did something it hasn’t managed in months and the timing wasn’t random. In a span of just 48 hours, three separate developments quietly aligned to flip the market’s mood, sending ETH surging back past the ₹2.4 Lakh mark. But here’s the twist: this rally wasn’t purely organic. Behind the scenes, over $3 billion in leveraged positions got wiped out, and short sellers bore the brunt of it. So was this a genuine trend reversal, or a classic short squeeze dressed up as bullish momentum?
Ethereum (ETH) price overview
At press time, Ethereum was trading at ₹2,42,134.00 with an intraday loss of -1%. Its market capitalization is $397.939B and the 24-hour trading volume is $13.42B. It has a circulating and total supply of 120.681M ETH.
What Fueled the bullish momentum in Ethereum?
Three catalysts landed within 48 hours (around August 19-20, 2026):
- US Treasury bond buyback expansion: Treasury Secretary Scott Bessent announced the department would at least double its long-dated debt buyback operations, raising the per-operation cap from around $2 billion to $4 billion. This pushed long-end yields lower and reopened risk appetite for crypto after months of being locked out.
- SEC’s proposed crypto capital-raising framework: The SEC published a proposal letting crypto projects raise capital under defined exemptions and exit securities classification once core managerial commitments are met.
- Clarity Act momentum: President Trump publicly pushed the Senate to act on the Clarity Act, which now has a procedural vote scheduled for September.
The market was badly positioned for this: over $3 billion in leveraged crypto positions got liquidated within 24 hours, with short positions making up about 92% (roughly $2.77 billion) of that damage, a short squeeze that amplified the move.
On top of the macro trio, ETH-specific tailwinds reinforced the rally: spot ETH ETFs pulled in $697M in weekly inflows (Aug 17–21), led by BlackRock’s ETHA at $537M, while BitMine expanded its treasury to 5.85M ETH ($14.3B), with 87% staked.
Ethereum price analysis on weekly timeframe
ETH price has displayed strong buying pressure on a major support level of ₹1.40 Lakh on the Weekly timeframe. Ethereum price has respected this support level four times since 2023. The price has taken support on this major support level after a strong selling pressure. After taking support, the price has surged by more than 55% and reached the 200-days EMA amid this bullish momentum.
The price has reclaimed ₹2.4 Lakh territory and is staying in this zone. If the price triggers a breakout from the 200-days EMA then buyers might show interest. Once the ETH price manages to sustain over the 200-days EMA, the trend can extend to the ₹3 Lakh territory soon.
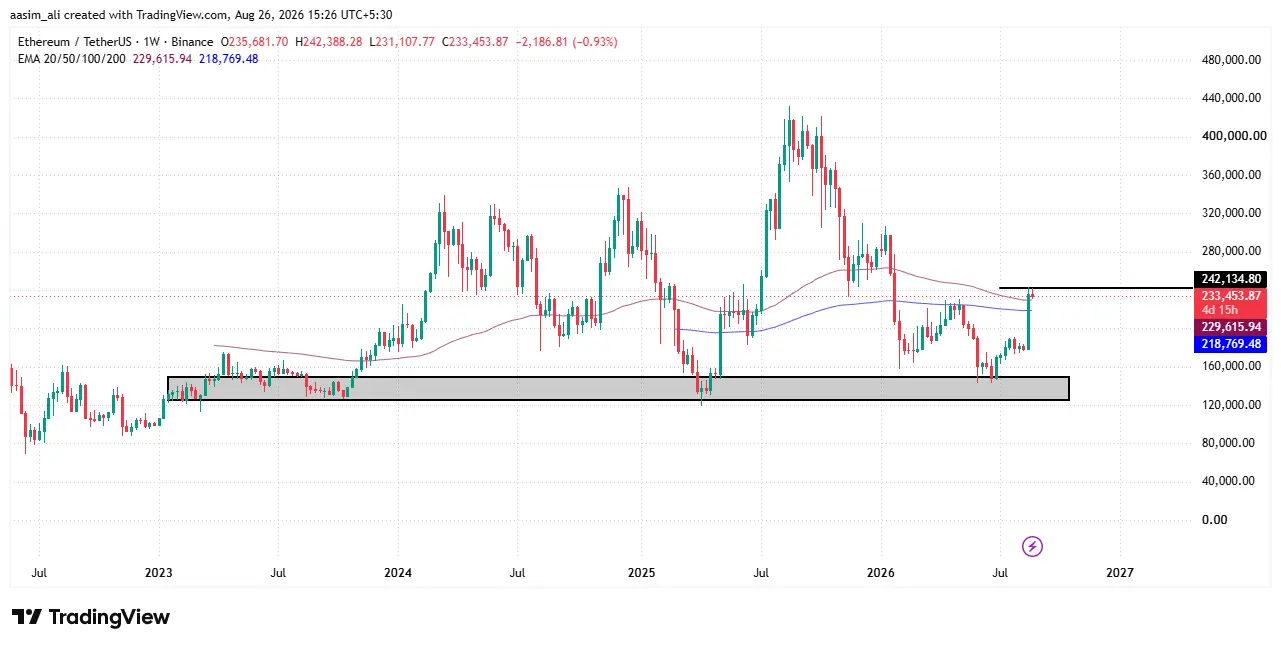
Conversely, if the price faces resistance from the 200-days EMA and forms any bearish candlestick pattern, sellers could hold the grip. The chart structure suggests that the current movement has grabbed the liquidity (short) from the previous high which could lead to a bearish trend.
Suppose the price drops to the major support level of ₹1.40 Lakh then buyers and sellers would struggle for their domination. If sellers win and pull the price below this support level, strong selling pressure can be seen. On the other hand, if buyers manage to defend this support level then the ETH price might trigger a bullish rally.
Ethereum price and volume analysis
Ethereum displayed a prolonged consolidation phase through late June and July, with prices oscillating between $1,500 and $2,000 despite moderate volume fluctuations of $20B–$45B. This sideways action changed sharply around August 20-21, when trading volume exploded to over $100B in a single session, nearly triple the prior average, coinciding with ETH’s price breaking out to a peak near $2,500. This volume-price alignment signals genuine buying conviction rather than a low-liquidity spike, historically a bullish confirmation signal. Post-breakout, volume has moderated to $60B–$65B while price has consolidated between $2,300-$2,450, suggesting the market is digesting gains rather than reversing.
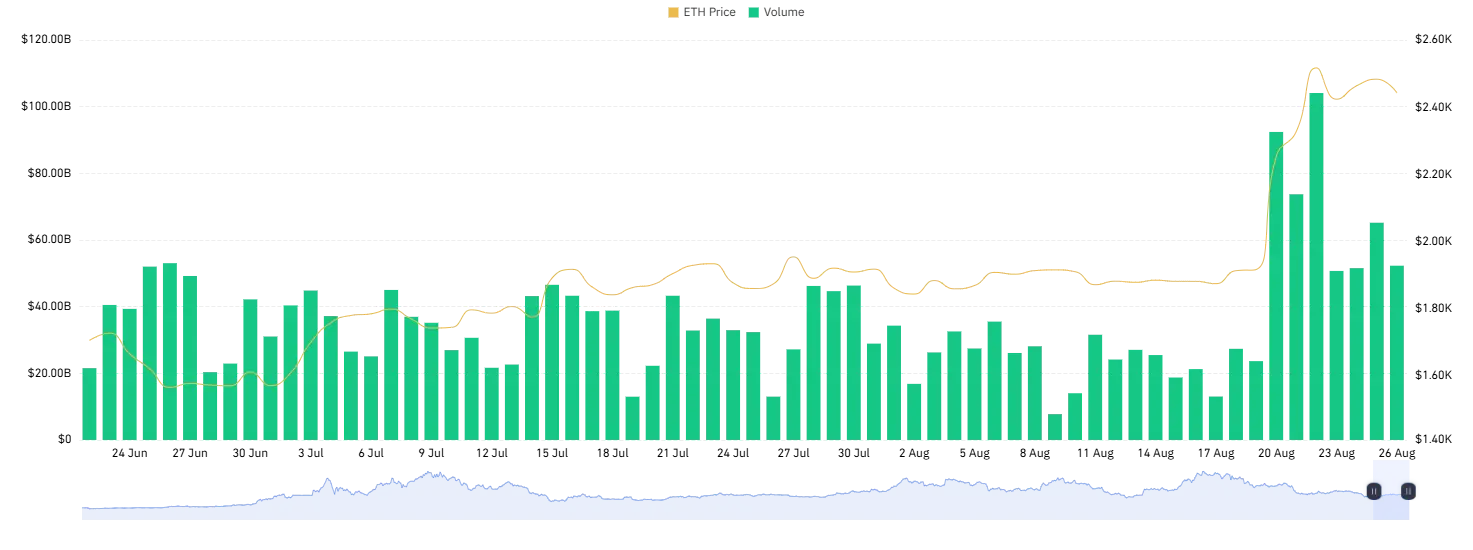
If this pattern holds, ETH could see a retest of the $2,500 resistance, with a decisive break potentially opening room toward $2,700-$2,800 in the near term. However, declining volume alongside flat price action warrants caution, a drop below $2,300 support could signal profit-taking pressure. This should not be considered financial advice.
Final Thought
Ethereum’s reclaim of the ₹2.4 Lakh mark looks less like an organic shift in sentiment and more like a case of the market getting caught leaning the wrong way at the wrong time. The three macro catalysts: Treasury’s expanded buybacks, the SEC’s proposed capital-raising framework, and Clarity Act momentum that gave the market a legitimate reason to turn risk-on, but the scale of the move was clearly amplified by the $2.77B in short liquidations. That combination makes this rally structurally fragile: real news created the spark, but forced short-covering did the heavy lifting.
The 200-day EMA is now the line in the sand. A confirmed breakout above it, backed by sustained ETF inflows and BitMine-style institutional accumulation, would give the ₹3 Lakh target real legs. But if ETH stalls here and slips back toward the $1,500 support zone, the “short squeeze dressed as a trend reversal” narrative will look prescient in hindsight.
What is the next key level for Ethereum price?
The 200-day EMA is the critical level to watch. A confirmed breakout above it, supported by continued ETF inflows and institutional accumulation (like BitMine’s treasury expansion), could open the path toward ₹3 Lakh. On the downside, ₹1.40 Lakh remains the major support level that has held four times since 2023.
How much did ETH ETFs and institutional buyers contribute to the rally?
Spot ETH ETFs saw $697 million in weekly inflows (Aug 17-21), with BlackRock’s ETHA leading at $537 million. Separately, BitMine expanded its Ethereum treasury to 5.85 million ETH (worth $14.3B), with 87% of those holdings staked, reinforcing the institutional demand narrative alongside the retail-driven short squeeze.