

Bitcoin price has been in a bullish trend since mid August and has surged by roughly 30%. In mid September, BTC price triggered a breakout and pushed the price over the $87,000. However, mild profit booking was seen and BTC started trading below the $85,000 level. Change in trading volume was also spotted which might impact the Bitcoin price. Let’s connect these dots and predict the Bitcoin price forecast.
How does Bitcoin work?
- Decentralization: No central bank or single owner manages Bitcoin. A global network of computers runs the system.
- Blockchain: Every transaction is saved on a public digital ledger called a blockchain.
- Mining: Special computers solve hard math problems to confirm transactions and add them to the blockchain. This process creates new Bitcoin.
- Limited Supply: Only 21 million Bitcoins will ever exist, which makes it scarce like gold.
Key Features
- Digital Only: Bitcoin has no physical form; it exists only as code on a network.
- Pseudonymous: Users do not need real-name bank accounts, though all public transactions can be viewed on the blockchain.
- Investment and Use: People use Bitcoin to buy items, transfer money across borders, or hold it as an investment.
Institutional Demand and Spot Bitcoin ETF Flows
Institutional demand is a big part of the current rebound. US spot Bitcoin ETFs drew $3.8 billion over three straight weeks, their strongest such stretch of 2026. That momentum has since cooled. The funds finished the week ending September 18 with only $6.2 million in net inflows, after $462.7 million in outflows the week before. A $43 million inflow on September 18 helped, led by Fidelity’s FBTC ($310.7M) and BlackRock’s IBIT ($108.4 million).
Overall, cumulative net inflows into U.S. spot Bitcoin ETFs have reached about $55.16 billion. Earlier in September, these funds held roughly $101 billion in net assets, about 6.33% of Bitcoin’s market cap.
This matters because ETF buying is direct spot demand, which fits the spot-led picture from CVD data and muted futures activity. The choppy weekly flows also show institutions are not buying aggressively yet. Steady daily inflows alongside a daily close above $82,000 would strengthen the breakout case toward $90,000. Renewed outflows could weaken support near $80,000.
Bitcoin price overview
At press time, Bitcoin was trading at $83,458.25 with an intraday loss of 1.1% and its market dominance was around 59.08%. Its market capitalization was $1.677T and the 24-hour trading volume was $26.775B. The circulating and total supply is 20.09M BTC while the maximum supply is 21M BTC.
Bitcoin price analysis over 1-D timeframe
Bitcoin price has remained bullish for the past few weeks. It was trading over the 200-days EMA on a daily timeframe which showcases the bulls’ domination. BTC price has witnessed a bullish move of around 15% in mid September. Furthermore, profit booking was started and bullish momentum has halted.
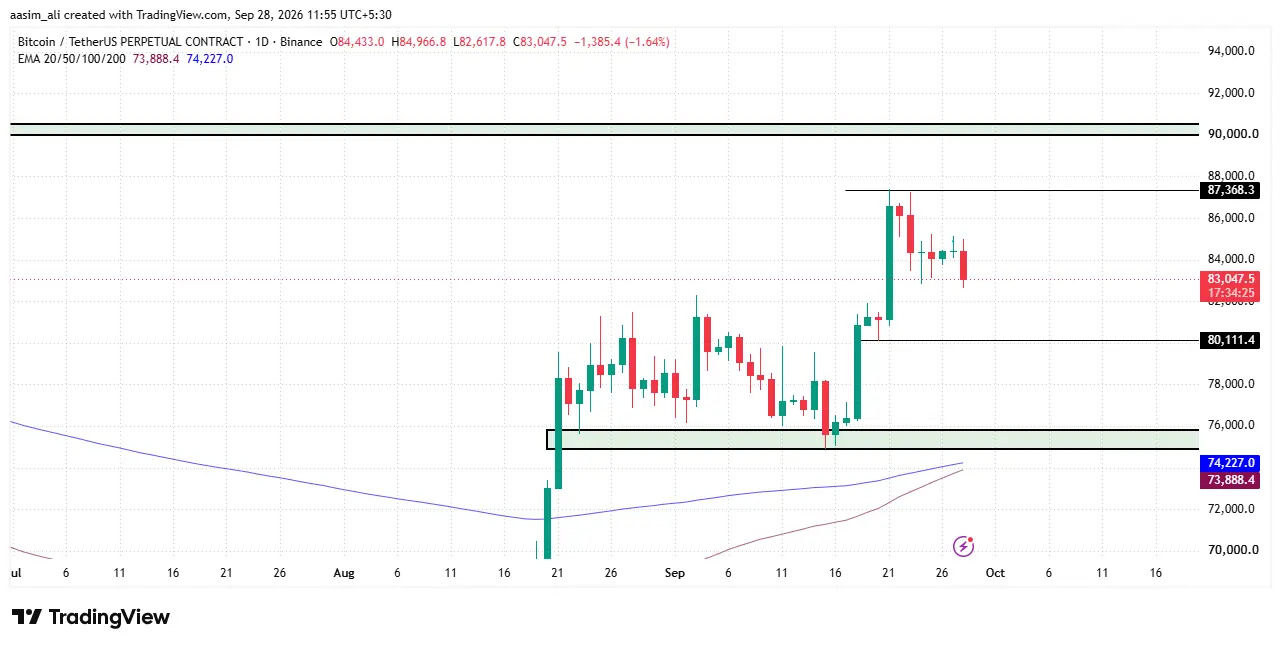
This profit booking could be a correction and price could run after a breakout. If Bitcoin price triggers a breakout from this correction phase, buyers may dominate again. Once Bitcoin price closes over the $87,360 level on a daily time frame, buyers may eye for the $90,000 level.
Conversely, if the profit booking increases then sellers may dominate ahead. If Bitcoin price closes below the $82,900 on a daily timeframe, buyers might panic and we can observe selling pressure. Sellers may drag the price to the immediate support level of $80,000.
Bitcoin price and volume outlook
Bitcoin traded in a tight $75,000-$84,200 range through most of September before a sharp breakout in the third week, pushing price to$86,000. Since then, BTC has consolidated around $84,000-$85,000, but volume has cooled significantly to $20B-$32B in several days.
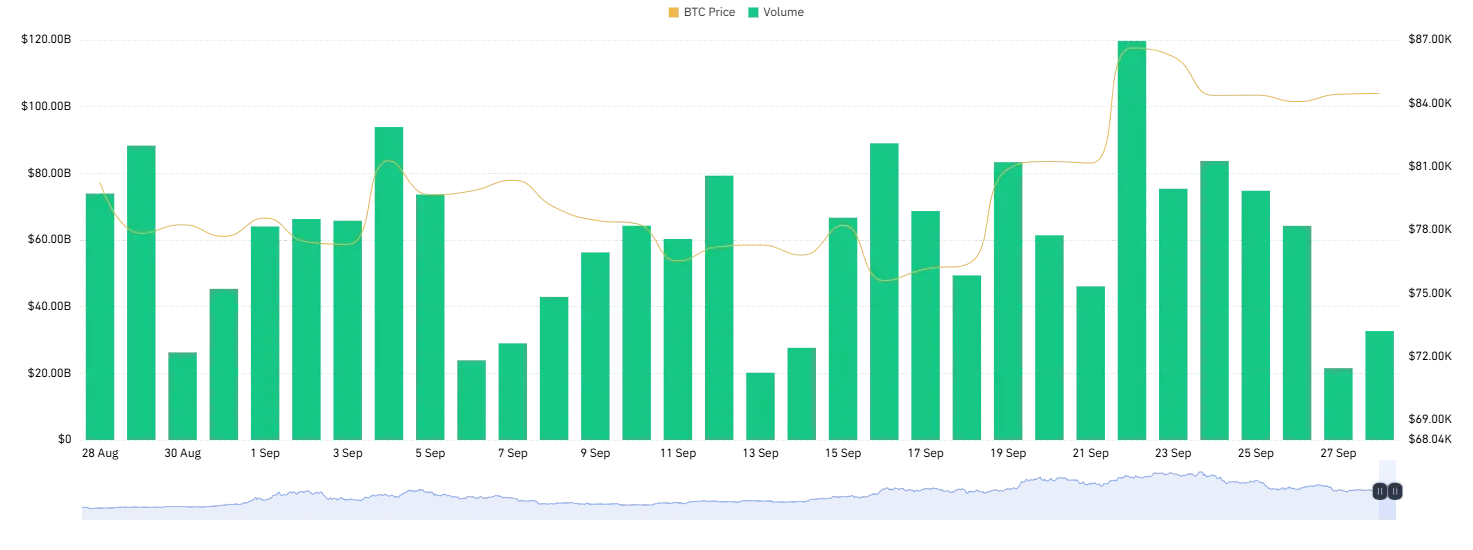
This drop in volume during consolidation is the key signal to watch. If BTC holds above $80,000 and volume picks back up, it would support a bullish continuation toward new highs, as the market digests gains before its next move. However, if volume stays weak and price slips back below $80,000, it could indicate the breakout lacked follow-through buying, opening room for a retest of the $75,000-$78,000 zone.
Final Thoughts
Bitcoin’s price action reflects a market caught between institutional optimism and short-term caution. The steady, if uneven, spot ETF inflows confirm that long-term demand remains intact, even as weekly flows show hesitation among larger players. Technically, BTC sits at a pivotal juncture: a daily close above $87,360 would likely reignite bullish momentum toward the $90,000 mark, while a slip below $82,900 could trigger panic selling toward the $80,000-$75,000 support zone. The declining volume during this consolidation phase is the most important signal right now; it suggests the market is pausing to digest recent gains rather than reversing outright. Traders should watch for a volume pickup as confirmation of the next directional move. Until then, Bitcoin remains range-bound, with both bulls and bears waiting for a decisive trigger. As always with crypto, conditions can shift quickly, so tracking ETF flows and volume trends closely will be key to anticipating BTC’s next leg.
Why did Bitcoin’s price drop after hitting $87,000?
After Bitcoin price broke out above $87,000 in mid-September, traders booked profits, pulling the price below $85,000. This is a common pattern after a strong rally, as early buyers lock in gains, temporarily cooling momentum.
What price level does Bitcoin need to cross to reach $90,000?
Bitcoin needs a daily close above $87,360 to signal renewed buyer strength. If this level breaks with strong volume, analysts expect the next target to be the $90,000 mark.
What happens if Bitcoin price falls below $82,900?
A daily close below $82,900 could trigger panic among buyers and increase selling pressure, potentially dragging the price down to the immediate support zone near $80,000, and possibly $75,000-$78,000 if selling intensifies.
How are Bitcoin ETFs affecting the price right now?
US spot Bitcoin ETFs saw $3.8 billion in inflows over three weeks, showing strong institutional interest. However, flows have since turned choppy, with a brief outflow week followed by modest inflows, suggesting institutions aren’t buying aggressively at current levels.