

Gold price has witnessed a sudden fall of 3.97% on Monday and has slipped below $4,200. It was trading below the key moving averages on a daily timeframe indicating bears’ grip. Trading volume and open interest has changed sharply during this fall. Let’s connect these dots and predict the gold price forecast.
Reason behind gold price dump
- Oil and inflation worries: A rise in oil prices heightened inflation concerns and reinforced expectations of further Federal Reserve rate hikes. Stalled US-Iran negotiations kept oil elevated, and Reuters reported that President Trump rejected an Iranian proposal to end the conflict.
- Hawkish Fed: Gold pays no interest, so higher rates and bond yields make it less attractive. Cleveland Fed President Beth Hammack said on Friday that persistently high inflation risks conditioning the public to accept elevated prices as the norm, and that the central bank cannot let that happen.
- Existing selling pressure: Gold was extending losses after a sharp weekly decline. Spot gold broke below $4,200 intraday, with a low of $4,179.42, and hit its lowest level in seven weeks.
Gold price technical analysis over 1-D timeframe
At press time, gold was trading at $4,138.39 with an intraday loss of 1%. Gold price has remained much volatile and has dropped by 3.97% on Monday. This was the biggest fall for the past 3 months. It displayed a gap down opening of 0.30% on Monday and kept falling throughout the day.
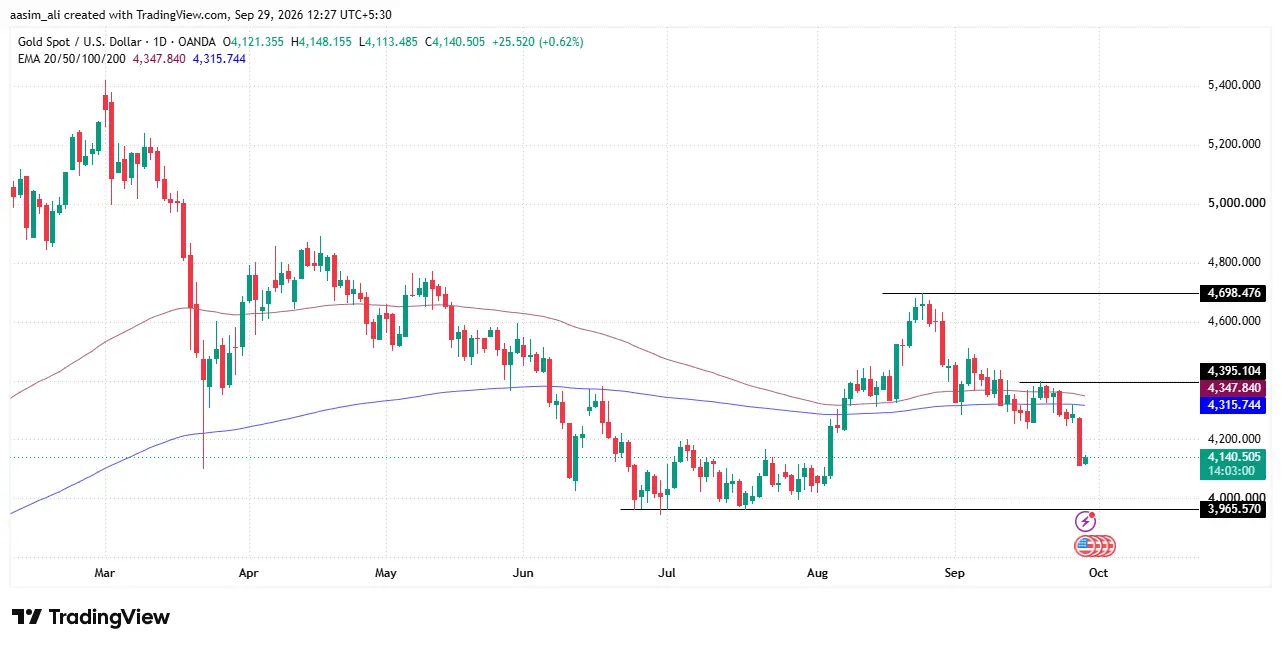
Gold price has been in a bearish trend on a daily timeframe. It has kept falling in a lower lows and lower highs pattern on a broader timeframe. In late August, the price has formed a lower high on a daily timeframe and has dropped by 12.32% in 35 days. Amid this bearish move, gold price has dropped below the key moving averages which showcases the sellers’ strength in the market.
According to this pattern, the price would remain bearish and can melt below a major support level of $3,965 to form another lower low. Once the gold price closes below this level on a daily timeframe, aggressive selling can be observed.
Conversely, if the XAU/USD price rebounds and closes over the immediate resistance level of $4,400 then buyers might be confident. Once the price holds above this resistance level, buyers may eye for the next resistance level of $4,700.
Gold Price Outlook: What Open Interest and Funding Rate Are Signaling
Gold (XAU/USDT) has fallen sharply from its high of $4,288.77 to a low of $4,116.60, and is now consolidating near $4,135 on the 15-minute chart. The interesting story lies beneath the price.
Aggregated open interest climbed from roughly $700 million to $1.05 billion during the decline. Rising open interest alongside falling prices typically means fresh short positions are being added, not just longs exiting. Funding rates, however, stayed positive and peaked near 0.02%, suggesting many traders were still buying the dip and paying to hold longs.
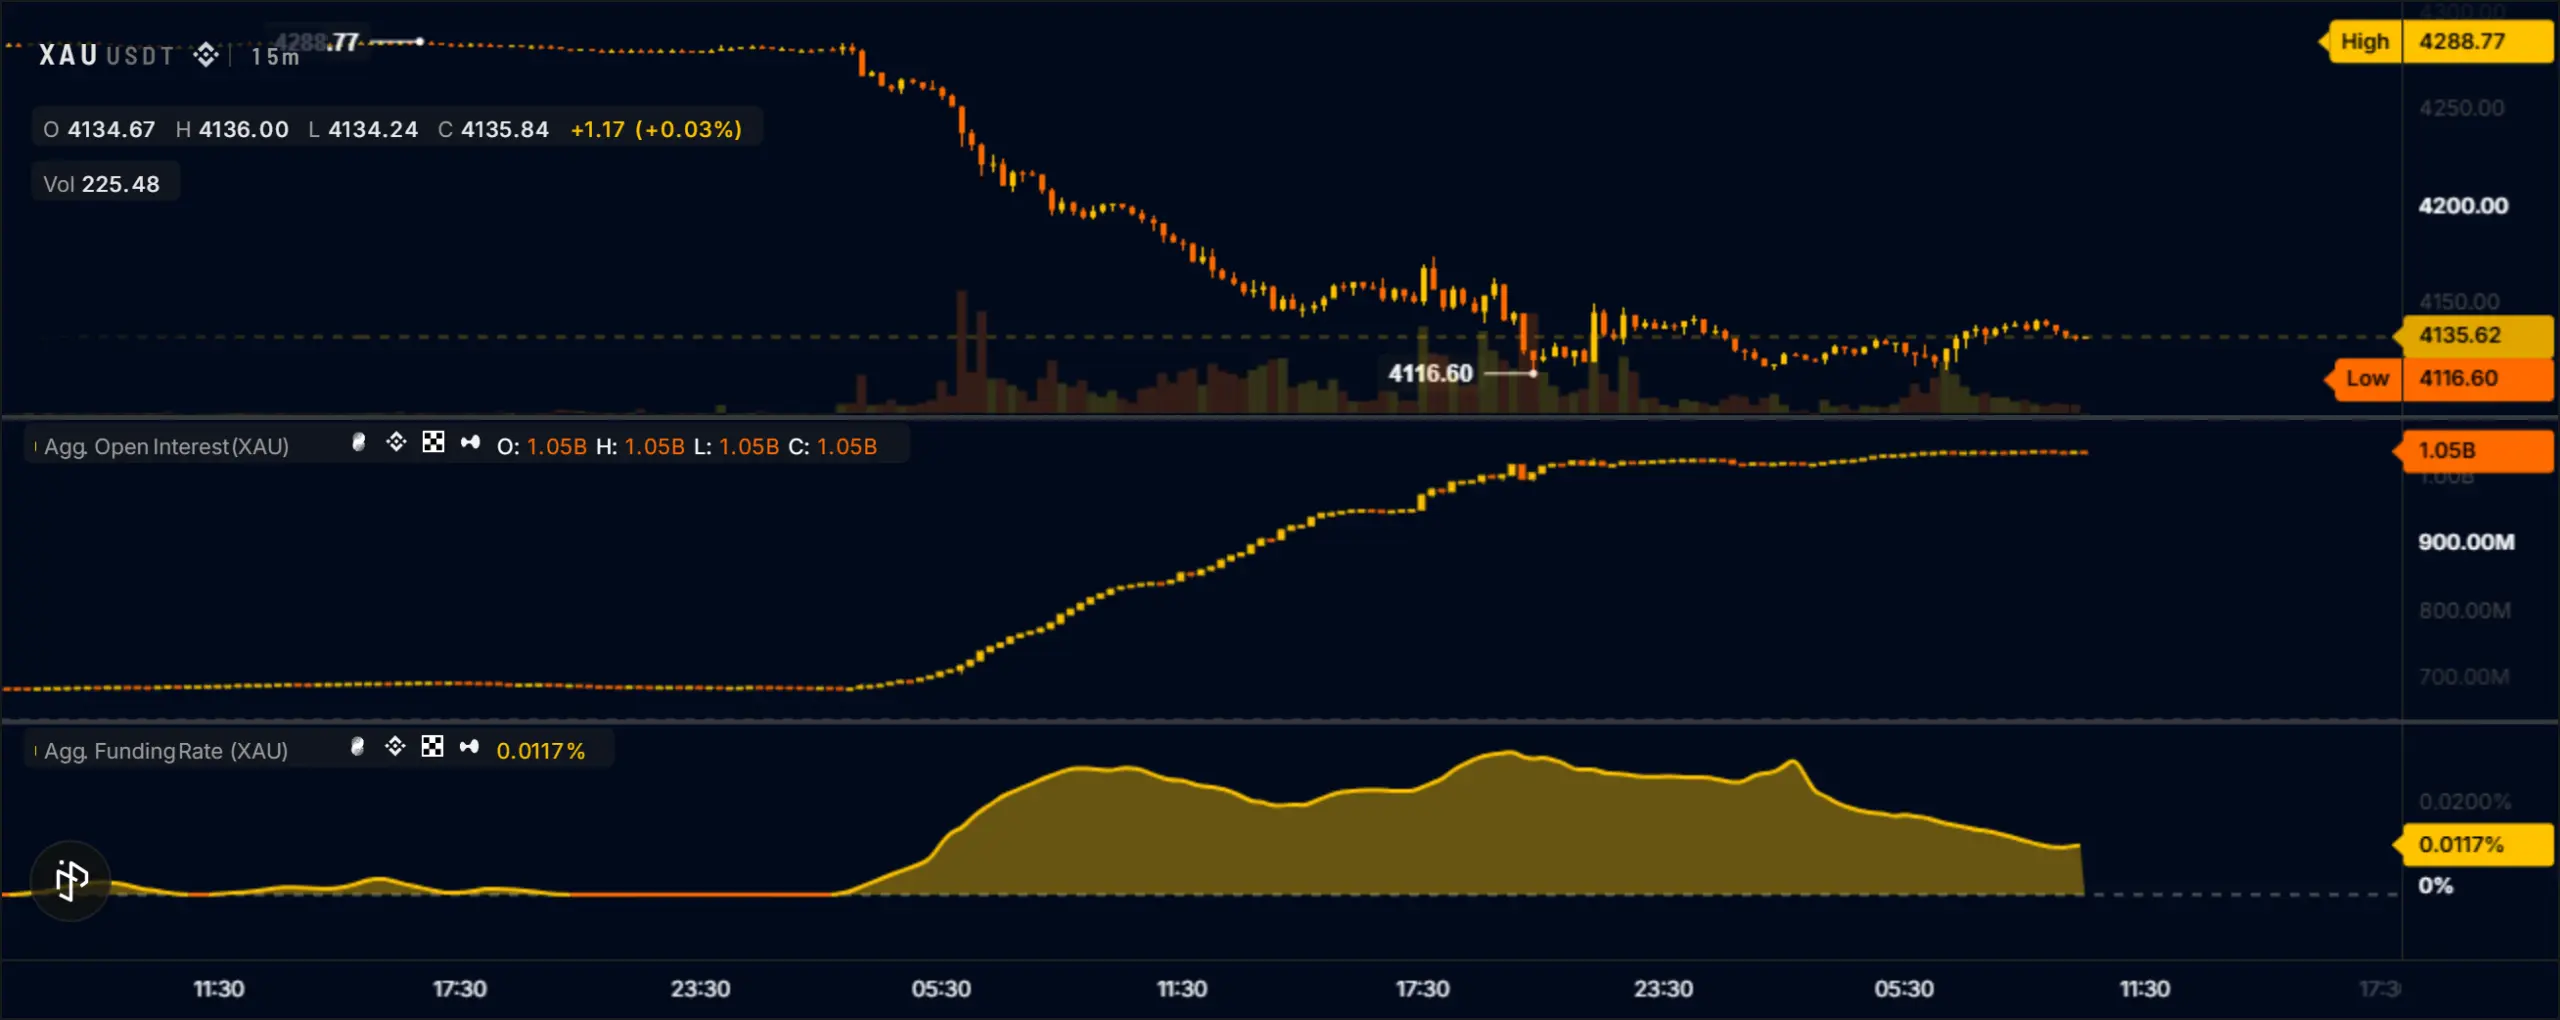
Funding has since cooled to 0.0117%, while open interest has flattened. This points to reduced leverage enthusiasm and a market at a decision point.
If $4,116 holds, a short squeeze toward $4,200 is possible. A breakdown below it could trigger long liquidations and extend the fall.
Gold Price Outlook: Volume Surge Meets a Sharp Pullback
Gold has been in a gradual downtrend since late August. Prices peaked near $4,650 around 25 August, then slid toward the $4,130 zone by the end of September, with a series of lower highs along the way.
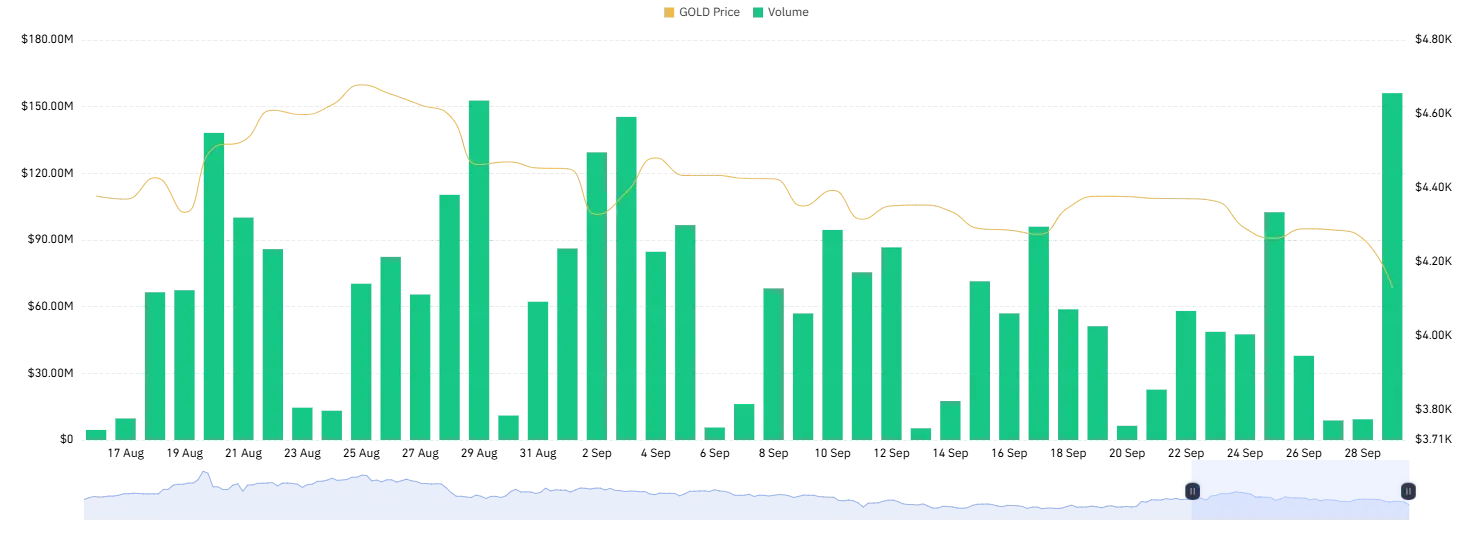
The most striking signal is the latest volume bar. Trading volume has spiked to roughly $155M, the highest in the period, just as the price dropped sharply. High volume on a falling price often indicates strong selling pressure or a capitulation-style move rather than a routine dip.
Forecast: In the short term, gold may stay volatile with a bearish bias. If it breaks below $4,100, the next support could be around $3,800-$3,900. However, heavy volume near a low can also mark exhaustion, so a technical rebound toward $4,250-$4,300 is possible if buyers step in.
Final Thought
Gold is under clear pressure. It fell 3.97% in a single day, its biggest drop in three months, and now sits near $4,138, below key moving averages. The drivers are a hawkish Fed, oil-fueled inflation worries, and stalled US-Iran talks. Since late August, gold has dropped roughly 12% in a pattern of lower highs and lower lows, so the trend remains bearish.
The derivatives data adds nuance. Open interest rose while price fell, which suggests fresh shorts were added, yet funding stayed positive, meaning many traders were still buying the dip. That mix leaves the market at a decision point.
The heavy-volume spike could signal capitulation, so a short-term bounce toward $4,250-$4,300 is possible. Until gold reclaims $4,400, though, the bias stays bearish and volatile.
Why did the gold price fall 3.97% on Monday?
Gold price dropped on the back of rising oil prices, inflation worries, and a hawkish Federal Reserve. Stalled US-Iran negotiations kept oil elevated, which strengthened expectations of further rate hikes. Since gold pays no interest, higher rates and bond yields make it less attractive.
What are the key support levels for gold now?
The immediate support sits near $4,116, followed by the major support at $3,965. A daily close below $3,965 could trigger aggressive selling, and a break below $4,100 may open the way toward $3,800-$3,900.
What are the key resistance levels for gold price?
The immediate resistance is at $4,400. If gold closes above it and holds, buyers may target the next resistance at $4,700.
What do open interest and funding rates say about gold?
Open interest rose from roughly $700 million to $1.05 billion during the fall, which suggests fresh short positions were added. Funding rates stayed positive, peaking near 0.02%, meaning many traders were still buying the dip. Funding has since cooled to 0.0117%, pointing to reduced leverage enthusiasm.