

Bitcoin price has witnessed strong buying pressure and pushed the price from $62K to $82K in just 35 days. BTC price has been struggling between the $75,500 level and $81,000 levels. Recently, a liquidity sweep beneath the $75,500 level was observed and a bullish move was spotted. Spot cumulative volume delta (CVD) has climbed back above perpetual CVD. Let’s explore how BTC would react after these changes.
How does Bitcoin work?
- Decentralization: No central bank or single owner manages Bitcoin. A global network of computers runs the system.
- Blockchain: Every transaction is saved on a public digital ledger called a blockchain.
- Mining: Special computers solve hard math problems to confirm transactions and add them to the blockchain. This process creates new Bitcoin.
- Limited Supply: Only 21 million Bitcoins will ever exist, which makes it scarce like gold.
Key Features
- Digital Only: Bitcoin has no physical form; it exists only as code on a network.
- Pseudonymous: Users do not need real-name bank accounts, though all public transactions can be viewed on the blockchain.
- Investment and Use: People use Bitcoin to buy items, transfer money across borders, or hold it as an investment.
Institutional Demand and Spot Bitcoin ETF Flows
Institutional demand is a big part of the current rebound. US spot Bitcoin ETFs drew $3.8 billion over three straight weeks, their strongest such stretch of 2026. That momentum has since cooled. The funds finished the week ending September 18 with only $6.2 million in net inflows, after $462.7 million in outflows the week before. A $433 million inflow on September 18 helped, led by Fidelity’s FBTC ($310.7 million) and BlackRock’s IBIT ($108.4 million).
Overall, cumulative net inflows into U.S. spot Bitcoin ETFs have reached about $55.16 billion. Earlier in September, these funds held roughly $101 billion in net assets, about 6.33% of Bitcoin’s market cap.
This matters because ETF buying is direct spot demand, which fits the spot-led picture from CVD data and muted futures activity. The choppy weekly flows also show institutions are not buying aggressively yet. Steady daily inflows alongside a daily close above $82,000 would strengthen the breakout case toward $90,000. Renewed outflows could weaken support near $80,000.
ETF flow numbers change daily, so re-check SoSoValue or Farside Investors just before publishing. I can also write a shorter version or a Hindi/Hinglish script version of this section if you need one.
Bitcoin Price Overview
At press time, Bitcoin was trading at $81,660.00 with an intraday gain of 1.4%. Its market capitalization was $1.642T and the 24-hour trading volume was around $23.675B. Its circulating and total supply is 20.087M BTC while the maximum supply is 21M BTC. Bitcoin dominance was 59.02% on September 21, 2026.
Bitcoin price technical analysis over 1-D timeframe
Bitcoin price has experienced strong buying pressure and has surpassed the 200-days exponential moving averages (EMA) on a weekly timeframe. Previous weekly closing was above the $81,000 level which showcases buyers dominance.
The weekly timeframe suggests that the BTC price has kept falling after touching a new all-time high (06, October 2025). Bitcoin price was falling in a lower lows and lower high manner on a weekly timeframe.
In July 2026, the price structure failed to form a lower low and buyers have bounced back. Buyers have pushed the price to the previous lower high zone. This structure suggests that buyers have made a comeback.
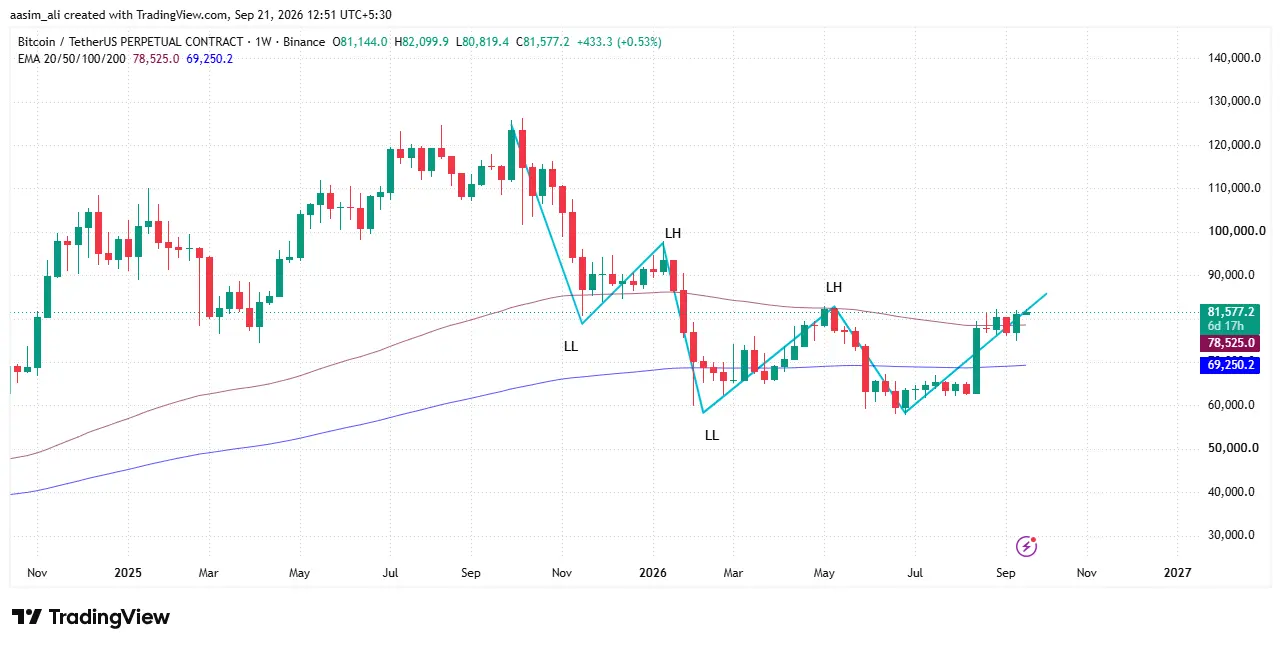
If the trading volume and OI increased amid the breakout of the $82,000 zone, strong buying pressure can be observed. Amid this bullish rally, Bitcoin price can reclaim the $100K mark in the next few months.
Conversely, if the Bitcoin price fails to close over the $82,000 level then buyers could lose the momentum. Any bullish candlestick pattern on a weekly timeframe can attract sellers. Once the price slips below the 100-days EMA, it may drop to $70K.
Analysis on Liquidity Sweep in Bitcoin
As we can see on the chart, BTC price has been in a bullish trend on a daily timeframe. After a strong bullish trend, BTC price undergone a correction phase and struggling between the $ 75,500 and $82,000 for the past 25 days.
Recently, Bitcoin price has grabbed the liquidity beneath the $75,595 level and has surged by 8.22% in just 6 days. Amid this bullish trend, the price has reached the $82,000 level.
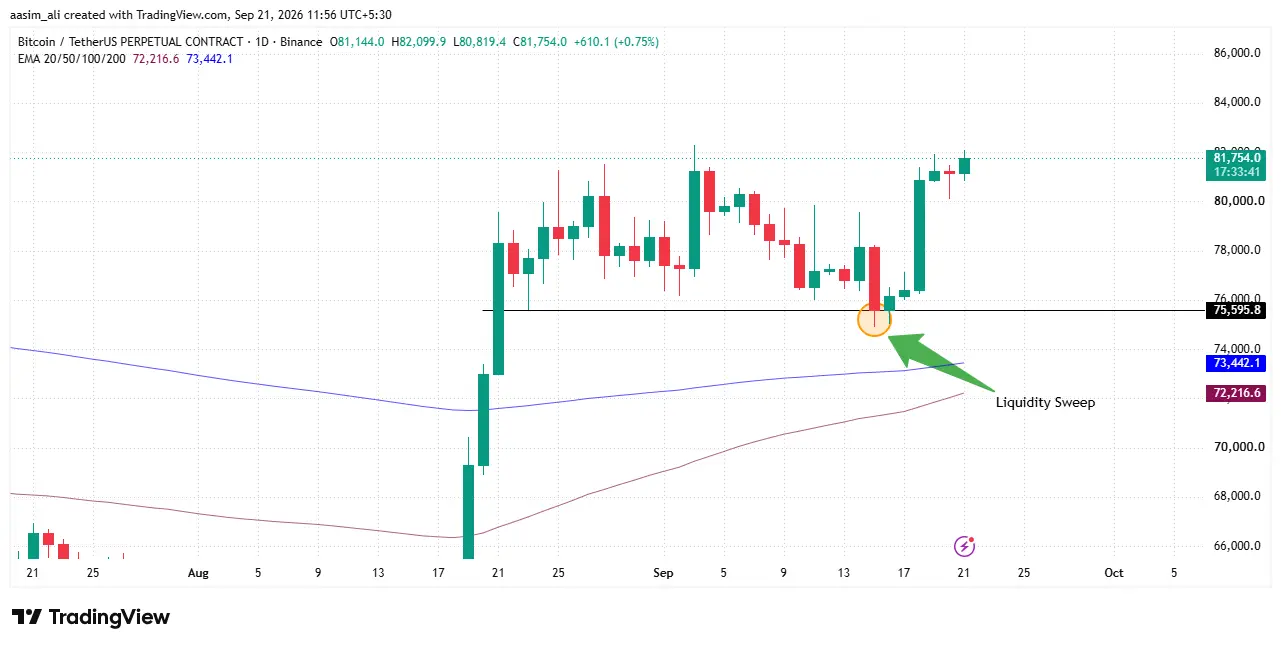
The recent buying pressure suggests that whales have shown interest after this liquidity sweep. If the price manages to sustain over the $82,000 mark buyers might be interested. Once Bitcoin price closes over the $82,000 level on a daily timeframe, strong buying pressure can be seen. Amid this buying pressure, the price is expected to hit the $90,000 mark in the next few weeks.
Bitcoin Price Prediction: Spot Buying Supports a Push Toward $90,000
Bitcoin is trading near $81,600 after recovering from a sharp sell-off on September 20 that pushed price close to $80,000. Aggregated order-flow data shows the rebound is led by spot buyers. Spot cumulative volume delta (CVD) has climbed back above perpetual CVD, and the latest Spot bars have turned positive. Perpetual futures activity is muted, which suggests the move isn’t driven by excessive leverage. The steady positive premium reading also points to consistent spot demand.
BTC price forecast: If buyers defend $80,000 support, Bitcoin could retest the $82,000 resistance. A clean breakout opens the path toward $85,000-$90,000. A close below $80,000 would risk a slide toward $79,000, and weakening spot CVD would be an early warning. Traders should watch spot flows and futures positioning for confirmation.
Final Thoughts
Bitcoin has rallied from $62K to around $81,600 in about five weeks, reclaimed the weekly 200-day EMA, and swept liquidity below $75,500 before bouncing. The rebound looks spot-led rather than leverage-driven: spot CVD is back above perpetual CVD, and futures activity is muted. That makes the move healthier than a typical short-squeeze rally.
The next test is the $82,000 resistance. A daily close above it, backed by rising volume and open interest, could open the path to $83,000-$90,000 and strengthen the case for a move toward $100K in the coming months. If buyers fail to defend $80,000, BTC could slide toward $79,000, and a break below the 100-day EMA could bring $70K back into play. Traders should watch spot flows and futures positioning for confirmation before drawing conclusions.
Can Bitcoin price break the $90,000 mark?
It’s possible. BTC first needs a daily close above the $82,000 resistance, ideally with rising trading volume and open interest. If that happens, the next targets are $85,000-$90,000. If BTC fails to close above $82,000, buyers could lose momentum.
What are the key support levels for Bitcoin price?
The immediate support is $80,000. A close below it could push BTC toward $79,000, and a slip below the 100-day EMA could bring $70K into play.
What is a liquidity sweep, and why does it matter for Bitcoin?
A liquidity sweep happens when price briefly dips below a level where many stop-loss orders sit, then reverses sharply. BTC swept the liquidity below $75,500 and then rallied toward $82,000, which suggests large buyers stepped in after the dip.