

PUMP price has experienced a bullish trend for the past few weeks. Amid this bullish trend, the price has exceeded the key moving averages which showcases the bullish trend. PUMP price underwent a correction phase after this bullish rally. Amid this correction phase, the price has triggered a breakout from the correction phase. OI and trading volume were also increased during the breakout which might impact the further price movement.
Fundamentals we should know about PUMP coin
- Buyback-and-burn mechanics
Pump.fun runs a programmatic buyback-and-burn: 50% of net revenue from its Bonding Curve, PumpSwap, and Terminal products is automatically used to buy back and burn PUMP via an irreversible smart contract. The remaining half funds product development, hiring, marketing, and potential acquisitions. This gives readers a “why” behind the token’s supply-side dynamics, not just price/OI. - Platform revenue trend
Pump.fun has generated about $1.13 billion in fees and $1.05 billion in revenue since launching in January 2024, but fee generation has cooled alongside the broader memecoin market, totaling about $23.5 million over the past 30 days. Tying declining/recovering platform revenue to the price action gives your bullish/bearish case more substance than just OI and volume. - Historical context on buybacks vs. price
Worth noting for balance: despite steady buybacks, supply cuts alone have not consistently lifted the price historically; this tempers the “buyback = bullish” narrative and adds nuance/credibility. - Ecosystem/product expansion
Mentioning newer revenue streams (PumpSwap, Terminal, cross-chain expansion via Padre on Base/Ethereum/BNB Chain) shows Pump.fun isn’t a single-product bet, useful for readers assessing long-term fundamentals vs. just short-term chart action. - Supply/tokenomics angle
You already cite circulating vs. total supply, you could add how much has been burned cumulatively (hundreds of millions of dollars’ worth historically) to frame current circulating supply trends as tightening, which ties back into your technical breakout narrative.
Pump.fun price overview
PUMP coin was trading at $0.004789 at press time with an intraday loss of 8%. Its market capitalization was $2.231B and the 24-hour trading volume was $477.598M. Its circulating supply is 465.746B PUMP and the total supply is 831.251B PUMP.
PUMP price analysis over 1-D timeframe
Pump.fun price has displayed a breakout from a descending trendline on a daily timeframe. Pump.fun price has witnessed a retracement of around 7% after this strong breakout.
PUMP price is falling towards the breakout zone to fill the orders. Once PUMP price reaches this zone and forms any bullish candlestick, buyers might bounce back. Any buying pressure in this territory can lead to a strong bullish trend.
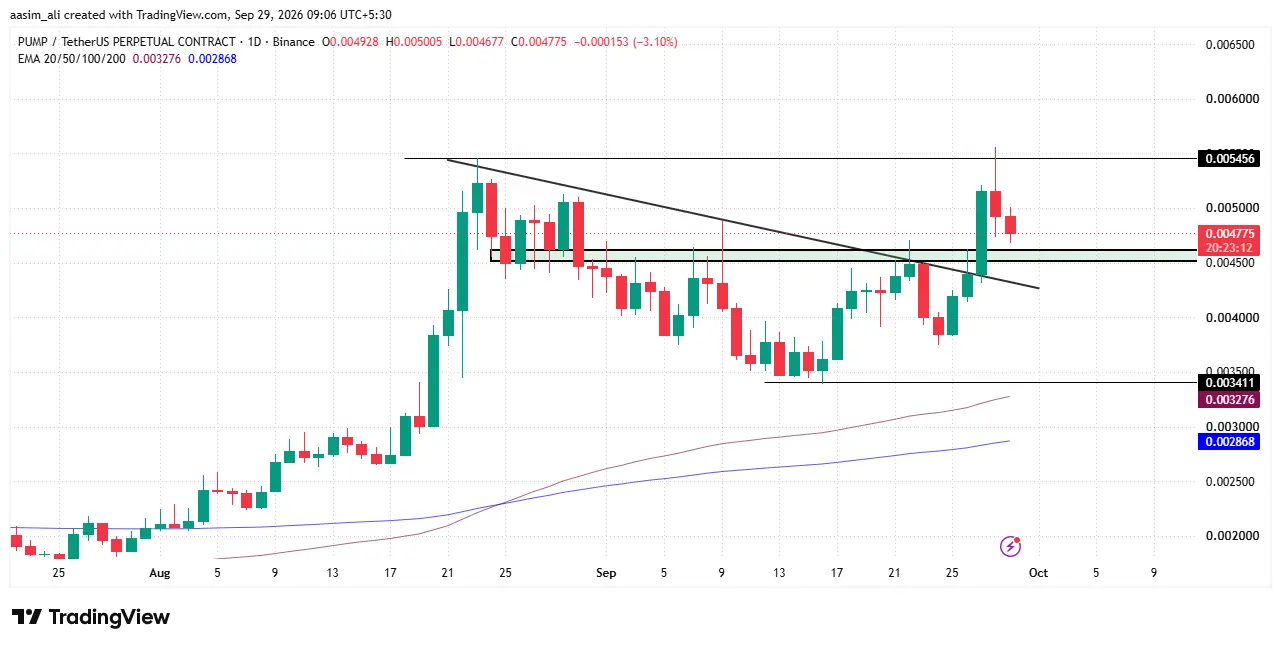
On the other hand, if the PUMP price dips below the previous resistance level of $0.0046, buyers would lose the momentum. Once the price sustains below this level, it would be considered as a fake breakout and the price may decline further.
PUMP price and Open Interest (OI) analysis for September
Through September, PUMP’s price action has closely tracked shifts in open interest, reflecting how leveraged positioning has driven momentum in either direction. Early in the month, open interest hovered near $430M while price traded around $0.0042 before a brief OI pullback to $370M coincided with price attempting to hold steady. A sharp open interest spike to nearly $480M by September 8-9 was followed almost immediately by a price decline, suggesting traders were adding leveraged shorts or long liquidations were building up.
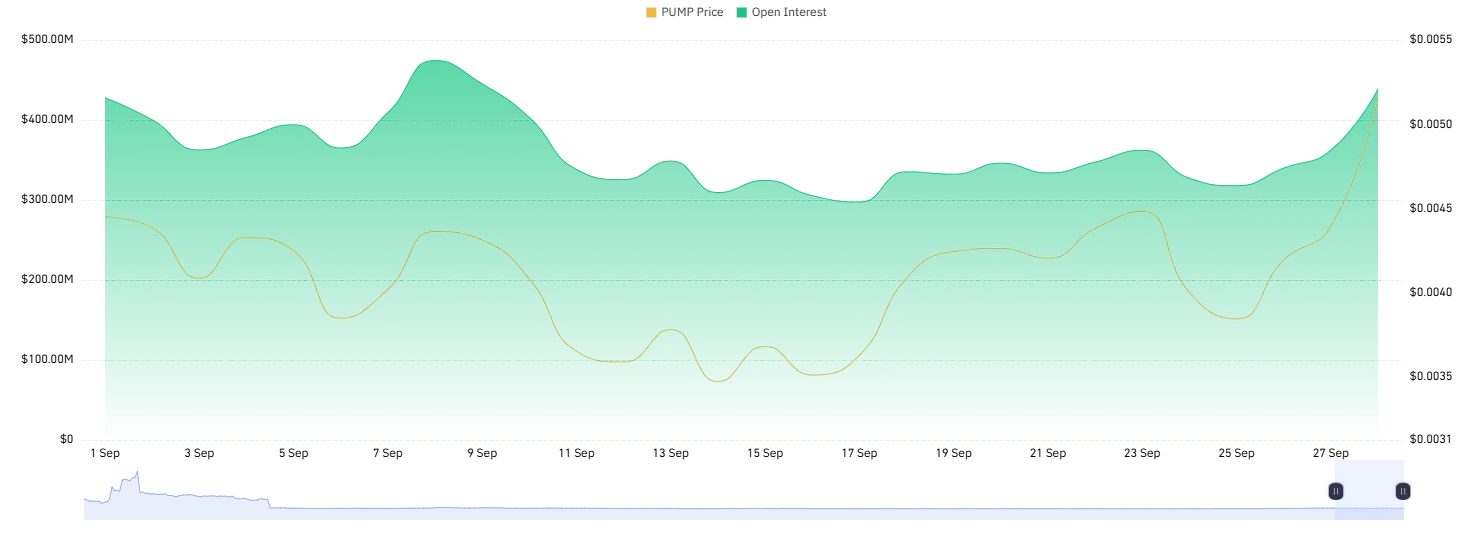
As open interest steadily contracted toward $300M by mid-September, PUMP’s price fell in tandem, bottoming near $0.0034-$0.0035, a sign that reduced market participation was compounding downward pressure. From September 19 onward, open interest gradually rebuilt into the $340-$360M range, accompanying a mild price recovery. The most notable move came in the final days, when open interest surged past $430M alongside a sharp price rally to $0.0052, indicating fresh capital and renewed bullish conviction entering the market simultaneously.
PUMP price and volume analysis
PUMP’s price action through September shows a classic volume-led recovery pattern. After dipping to around $0.0034 on September 16, coinciding with lower trading volumes in the $300 range, the token has staged a sharp rebound, climbing toward $0.0052 by September 28. Notably, this latest rally is backed by a significant volume surge, with daily trading volume jumping to nearly $750M on September 28, one of the highest readings of the month, second only to the $950M peak seen around September 10.
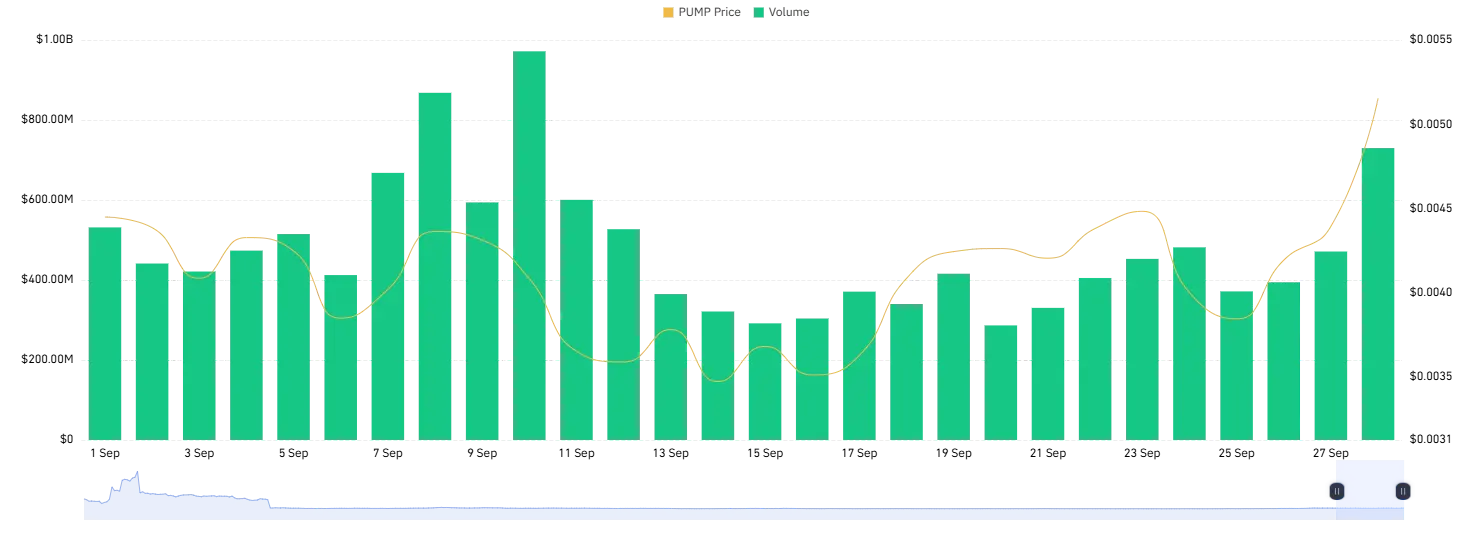
This alignment of rising PUMP price and expanding volume is typically read as a bullish signal, suggesting genuine buying interest rather than a low-liquidity spike. If volume continues to build alongside price, PUMP could attempt to retest its early-September highs near $0.0045–$0.0052 and potentially push higher. However, traders should watch whether volume sustains at these elevated levels, as a price rise without follow-through volume often precedes a pullback.
Final thoughts
PUMP’s September price action tells a fairly clean story: sharp corrections followed by aggressive dip-buying, with open interest and volume moving in lockstep with price rather than against it. That alignment is what gives the current breakout more credibility than a typical short squeeze; fresh capital appears to be entering rather than shorts simply being forced out.
That said, the setup isn’t confirmed yet. The token is now retesting the breakout zone after its 7% retracement, and how it behaves here will likely decide the next leg. A bounce with rising volume near this zone would support continuation toward the $0.0045-$0.0052 range. But a daily close below the $0.0046 support level would invalidate the breakout thesis and open the door to a deeper pullback, especially since PUMP remains a high-beta, sentiment-driven asset where OI unwinds can happen quickly.
What caused the recent breakout in PUMP price?
PUMP broke out from a descending trendline on the daily chart, backed by a sharp rise in open interest and trading volume, signaling fresh capital entering the market rather than a short squeeze.
What is the key support level to watch for PUMP?
The $0.0046 level is critical. If PUMP sustains below this zone, the breakout could be considered a fake breakout, opening the door for further downside.
Is the current PUMP price rally backed by strong fundamentals or just hype?
The rally appears to be volume-led, with trading volume climbing to nearly $750M on September 28, among the highest levels of the month. This alignment of rising price and volume typically signals genuine buying interest rather than a low-liquidity spike.