

For seven and a half months, XRP price did almost nothing. It opened 2026 at $1.85, spiked to $2.41 in the first week of January, and then spent the rest of the year bleeding out. By late June it had carved a cycle low near $1.01 and settled into a range so narrow it stopped generating headlines. Traders who had spent years waiting on the SEC case, the ETF approvals, and the institutional bid found themselves watching a top-ten asset trade like a savings account with worse odds.
Then, in the space of four days, XRP put on nearly 70%.
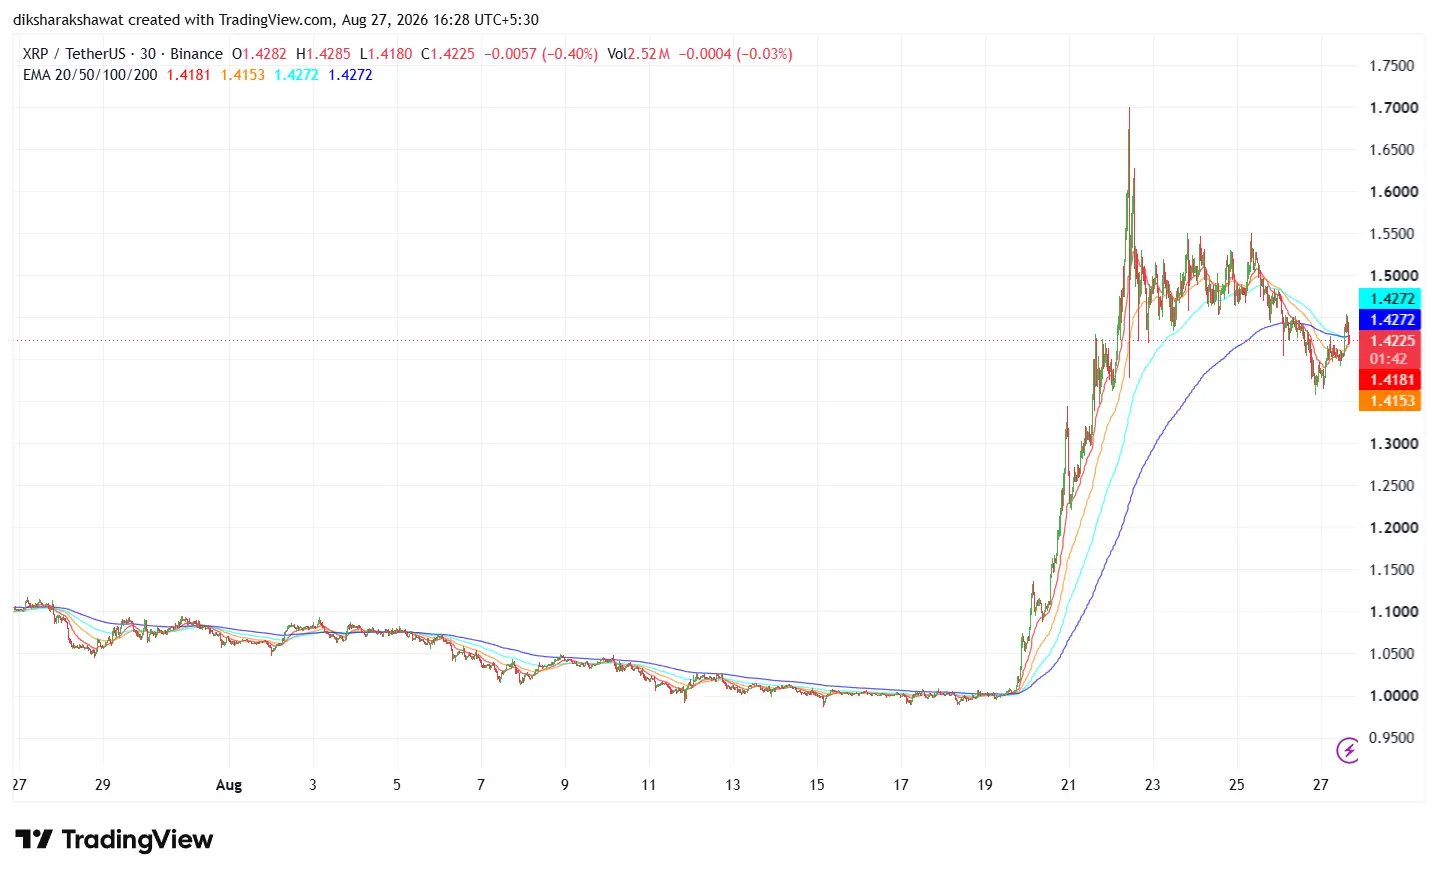
The token climbed from a cycle low of $0.9877 on August 17 to high of $1.69 on August 22, a move that outpaced Bitcoin’s 23.6% and Ethereum’s 28.1% over the same stretch by a wide margin. It briefly printed $1.6999, close enough to the psychological $1.70 that traders started talking about $2 again.
And then it gave a good chunk of it back. XRP price now trades in the $1.40s, roughly 13% below the August 22 peak, with intraday lows stretching that drawdown closer to 18%. What happened in between is a useful case study in how thin altcoin liquidity actually is and in what separates a leverage unwind from a genuine reversal.
XRP price setup: exhaustion, not optimism
The rally did not start because anyone got bullish. It started because almost nobody was left to sell.
XRP entered August at $1.06, down roughly 43% from its January peak and more than 70% below the $3.65 all-time high set in July 2025. Weekly momentum readings had fallen to levels seen only once before in the token’s history, at the 2022 bottom, when XRP price traded near $0.29. Readings that extreme don’t appear at the start of a decline. They appear after months of grinding; attrition has already cleared out the impatient money.
Two supply-side facts reinforced the picture. XRP held on centralized exchanges had fallen to roughly 1.6 billion tokens, the lowest level in seven years. And Ripple had executed one of its tightest net escrow unlocks on record, re-escrowing an unusually large share of the monthly release rather than letting it hit the market.
None of that is a buy signal on its own. Coiled springs stay coiled indefinitely without a catalyst. But it meant that when a catalyst arrived, there was very little supply standing in the way.
What lit the fuse on XRP price?
The catalyst came from outside crypto entirely.
On Wednesday, August 19, the US Treasury under Secretary Scott Bessent announced it would at least double the size of its long-end buyback operations, lifting the cap from $2 billion to a minimum of $4 billion per operation, running from September 9 through November 4. The announcement landed one day after the 30-year Treasury yield touched 5.34%, its highest reading since 2007.
The mechanism is straightforward. A 30-year yield above 5% pulls capital out of risk assets and into bonds that suddenly pay well without the volatility. Treasury’s intervention broke that pressure. Yields fell immediately, the 30-year dropped to 5.196%, and the dollar slid to a three-month low against major peers. Liquidity conditions loosened, and capital rotated back down the risk curve.
Bitcoin led, running toward $80,000 on renewed spot ETF demand. Altcoins followed with the leverage that beta always brings. XRP price outperformed Bitcoin by roughly two-to-one during the initial leg, and the reason is structural rather than flattering: Bitcoin now has spot ETFs at scale, corporate treasury demand, and settled regulatory status, so capital treats it as the low end of the crypto risk spectrum. XRP has a fraction of that infrastructure. It falls harder when liquidity tightens and climbs faster when it loosens.
A political tailwind arrived the same day. President Trump met crypto executives at the White House, among them Ripple CEO Brad Garlinghouse, Coinbase’s Brian Armstrong, and SEC Chair Paul Atkins, and pressed the Senate to move on the CLARITY Act, the bill that would formally settle whether XRP and similar assets fall under securities law. The Senate had sidelined that legislation on July 27, removing what had been the year’s most-watched catalyst. Its sudden reappearance on the agenda gave the technical move a narrative to hang on to.
August 22: the wick
The unwind was violent, and it was fast.
On Saturday, August 22, XRP price tagged $1.69 and then fell into the $1.46–$1.51 range within minutes, a drop of roughly 12%, with a brief wick well below that as the cascade ran. Across the broader crypto market, liquidations reached somewhere between $1.35 billion and $1.7 billion over 24 hours, including roughly $500 million in leveraged long positions and about $121.7 million in XRP specifically. Bitcoin fell 2.5% over the same window, Ethereum dropped 5%, and Solana slid 11.5%.
The asymmetry tells the story. A 2.5% move in Bitcoin does not cause a 37% wick in a top-ten asset unless positioning has become extraordinarily one-sided. XRP’s daily RSI had reached 88 at the peak, a level last seen at the July 2025 all-time high. Funding rates had turned firmly positive, meaning longs were paying shorts to hold their positions, the market’s clearest tell that everyone had crowded onto the same side of the boat.
Weekend liquidity made it worse. Saturday order books are thin, market makers are less committed, and a cascade of forced liquidations has less depth to absorb it. The $1.07 print was not a price discovery event. It was a liquidity vacuum.
Prices recovered quickly, but the damage to positioning was done. Funding rates turned negative during the crash and have not fully normalized since.
What held?
The most interesting data from the week is the part that didn’t move.
US spot XRP ETFs logged nine consecutive days of net inflows through the rally and the crash alike. The complex took in $14.50 million on August 21 and another $9.09 million on Monday, August 24, after the flash crash, not before. August inflows have surpassed $48.25 million, more than double July’s $27.29 million, and the week ending August 21 delivered $39.78 million, the strongest weekly figure since May.
Trading activity set records. XRP ETF volume hit an all-time high of $125 million on August 20, up 42% from the previous record set in November 2025, with Bitwise’s product accounting for 67% of that. Monthly volume across the complex has topped $508 million. Cumulative net inflows since the November 2025 launch stand at roughly $1.57 billion.
On-chain data points the same direction, with one caveat. Crypto.news, citing on-chain analytics, reported that addresses holding between one million and ten million XRP lifted their aggregate holdings from 16.05 billion to 16.36 billion during the week of August 18, a gain of roughly 310 million tokens. Most of that buying happened while XRP price still traded near $1, which makes it evidence of positioning ahead of the breakout rather than conviction held through the crash.
That combination of institutional flows, steady mid-tier wallets accumulating, and a price down 13% from the high is the signature of a leverage problem, not an exit.
The counterweight
None of which resolves XRP’s structural issue.
Ripple’s escrow releases roughly 200 to 400 million XRP per month in net terms. ETF absorption currently runs near 109 million. Until that ratio inverts and stays inverted for consecutive months, new supply outpaces the institutional bid regardless of how the chart looks. Prediction markets have priced this soberly: Kalshi contracts have carried roughly 70% odds of a sub-$1 print at some point during 2026.
XRP price also remains more than 60% below its July 2025 record, and August has historically been its flattest month, averaging a 0.43% return with four consecutive losing years going in.
The levels that matter now
The immediate battleground is $1.40, the zone that flipped from resistance to support during the breakout, where XRP reclaimed its 200-day moving average. Holding it on a daily close keeps the rally structurally intact as a normal cooldown. Losing it opens the Fibonacci 0.382 retracement near $1.40 and a path toward $1.30. On the upside, reclaiming $1.45–$1.50 and then $1.56 is the prerequisite for another run at $1.69.
The macro calendar decides most of this. The Jackson Hole symposium runs August 27–29, with Fed Chair Kevin Warsh delivering his first keynote as chair on Friday, August 28. The theme the Kansas City Fed selected, “Financial Innovation: Implications for Payments and Policy,” puts the year’s single most-watched monetary event directly on XRP’s home turf. Warsh described the speech as “a blank piece of paper” at his July 29 press conference, and he has offered little forward guidance since taking office in May.
Bitcoin remains the proximate driver. Above $80,000 with a break through the May high near $83,000, XRP price likely retests $1.70. Below $75,000, $1.30 comes into play.
The week proved XRP can still move like it used to. It also proved why that cuts both ways.
Disclaimer: Crypto products and NFTs are unregulated and can be highly risky. There may be no regulatory recourse for any loss from such transactions. Nothing in this article constitutes financial, investment, or tax advice.
Why did XRP suddenly rally 70% in August 2026?
The catalyst came from outside crypto. On August 19, the US Treasury announced it would at least double its long-end buyback operations, lifting the cap from $2 billion to a minimum of $4 billion per operation. The 30-year yield fell from 5.34% to 5.196%, the dollar hit a three-month low, and capital rotated back into risk assets. XRP, with less institutional infrastructure than Bitcoin, moved roughly twice as hard.
How high did XRP actually go?
XRP reached an intraday high of $1.69 on August 22, briefly printing $1.6999. That was a three-month high and a gain of nearly 70% from the cycle low of $0.9877 set on August 17.
What caused the crash on August 22?
A leverage unwind. XRP fell from $1.69 into the $1.46–$1.51 range within minutes, roughly 12%, with a deeper wick as the cascade ran as between $1.35 billion and $1.7 billion in crypto positions were liquidated over 24 hours, including about $500 million in leveraged longs. Bitcoin fell only 2.5% in the same window. Thin weekend order books amplified the cascade.
Is the XRP rally over?
The technical structure has not broken. XRP has not returned to test its breakout level near $1.01, and the August 17 swing low at $0.9882 remains untouched. The immediate test is whether $1.40 holds on a daily close. Below that, $1.30 comes into play; above $1.56, another run at $1.69 becomes plausible.
Are institutions selling XRP?
The flow data says no. US spot XRP ETFs logged nine consecutive days of net inflows through both the rally and the crash, taking in $13.82 million on August 24, after the flash crash. August inflows have topped $56.86 million, more than double July’s $27.29 million, with cumulative inflows since the November 2025 launch at roughly $1.57 billion.
What is the biggest structural risk to XRP’s price?
Supply absorption. Ripple’s escrow releases roughly 200 to 400 million XRP per month on a net basis, while ETF absorption currently runs near 109 million. Until that ratio inverts and holds for consecutive months, new supply outpaces the institutional bid regardless of short-term price action.
How far is XRP from its all-time high?
XRP remains more than 60% below the $3.65 record set on July 17, 2025. Even after the August rally, the token trades near levels it last saw three months ago rather than anywhere close to cycle highs.