

Ethereum price has witnessed a trend reversal momentum. The price has travelled to $2,500 from $1,600 in around 70 days. The price has exceeded the key moving averages on a daily timeframe amid this bull run. Trading volume and Open Interest have also witnessed great changes amid this bullish move. Let’s explore the Ethereum price forecast based on these data.
Ethereum (ETH) price overview
At press time, Ethereum price was trading at $2,484.06 with an intraday loss of 0.5%. Its market capitalization was $303.264B and the 24-hour trading volume was around $10.651B. Its circulating and total supply is 122.03M. ETH price has been in a bullish trend since July and surged by around 60%.
Ethereum price in a breakout territory: Can it hit $3,000 mark post breakout?
Ethereum price has delivered outstanding performance since July and has reached the $2,500 zone from $1,600. Amid this bullish trend, the price has surpassed the key moving averages on a daily timeframe. After this bull run, the momentum has halted near the $2,500 territory. ETH price has been struggling to close over the $2,500 level on a daily timeframe and trading between the $2,400 and $2,500 levels for 18 days.
If Ethereum price price triggers a breakout from the major resistance from the $2,500 and closes over this level on a daily timeframe, buyers might be attracted. If the trading volume and OI increases during the breakout, it could be a bullish sign. Increasing OI with price assumes that new entries are being made and can continue the trend. So a breakout following these scenarios can lift the price to the $3,000 mark in a few weeks.
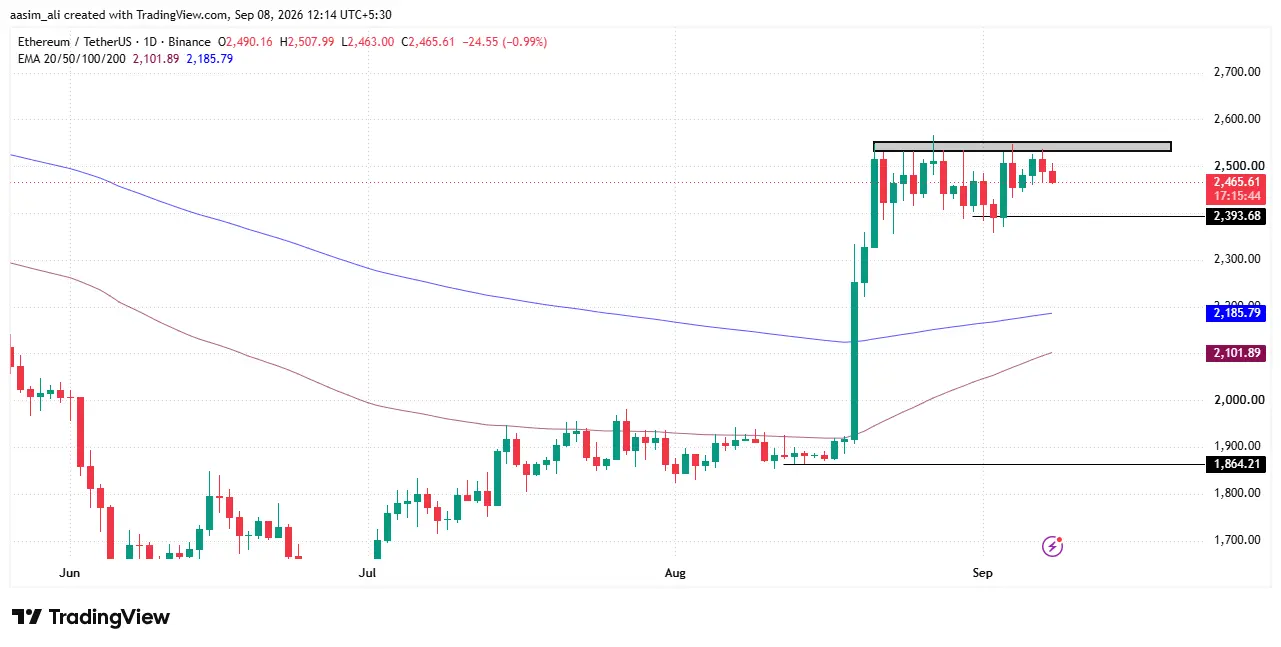
Conversely, if the Ethereum price fails to trigger a breakout from the resistance zone of $2,500 then sellers may dominate. Once the price closes below the $2,400 on a daily timeframe, buyers may lose the momentum. If the profit booking increases in this zone, the price may melt to the 200-days EMA on a daily timeframe. Once the price slips below the 200-days EMA, sellers may pull the price to the next support level of $1,860.
Ethereum price and Open Interest (OI) analysis
Based on the chart, ETH staged a sharp breakout in late August, jumping from roughly $1,870 to $2,550 within a few days, while Open Interest simultaneously expanded from around $26B to over $33B. This tells a story: the rally wasn’t just short covering, since OI kept climbing alongside price, which usually points to genuine new capital entering the market rather than a temporary squeeze.
Since then, ETH has consolidated in the $2,3800–$2,550 range, with OI holding steady near $30–33B instead of unwinding. That’s a bullish signal; traders aren’t rushing to close positions, suggesting confidence that higher levels are the new base rather than an overextension.
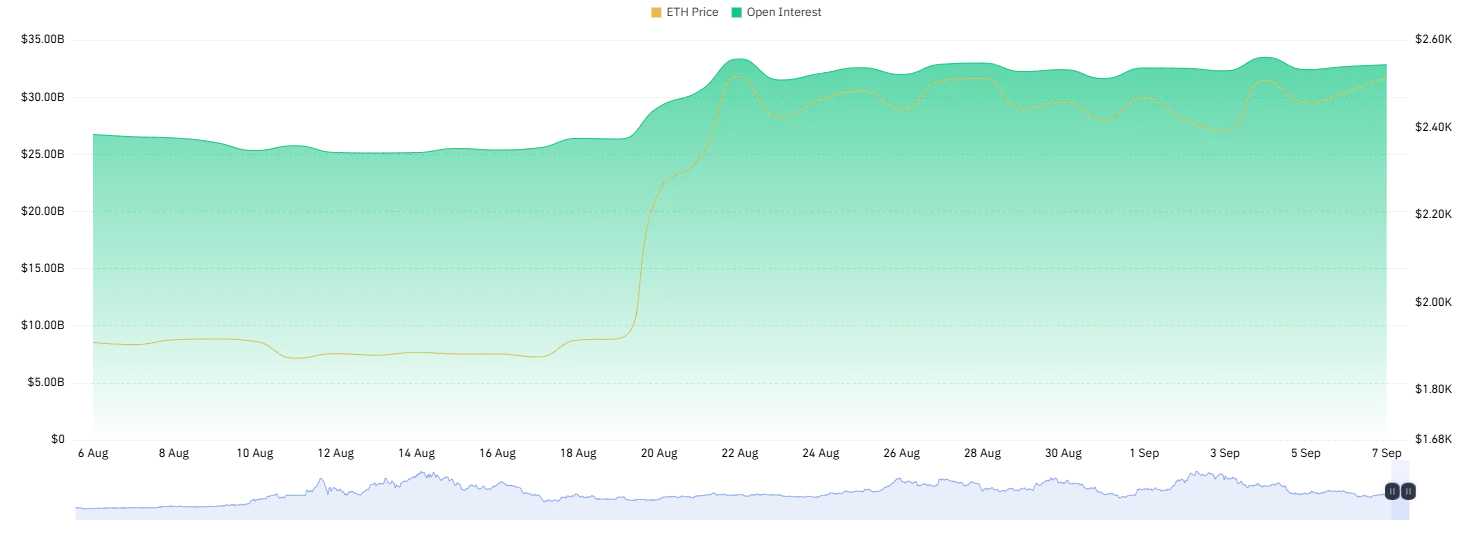
If this OI floor holds, ETH looks positioned to retest the $2,550 highs, with a breakout potentially opening the path toward $2,800–$3,000 in the near term. However, a drop in OI alongside falling price would flag position unwinding and could signal a deeper pullback toward $2,300.
Ethereum price and volume analysis
Ethereum has shown a strong bullish structure over the past month, climbing from around $1,850 on August 8 to nearly $2,450 by September 7, a gain of roughly 30%. The most decisive move came between August 20–22, when trading volume exploded to nearly $104B, coinciding with ETH breaking sharply above the $2,000 resistance zone and rallying to a local high near $2,550. This volume-backed breakout suggests strong institutional and retail participation, lending credibility to the move rather than it being a low-liquidity spike.
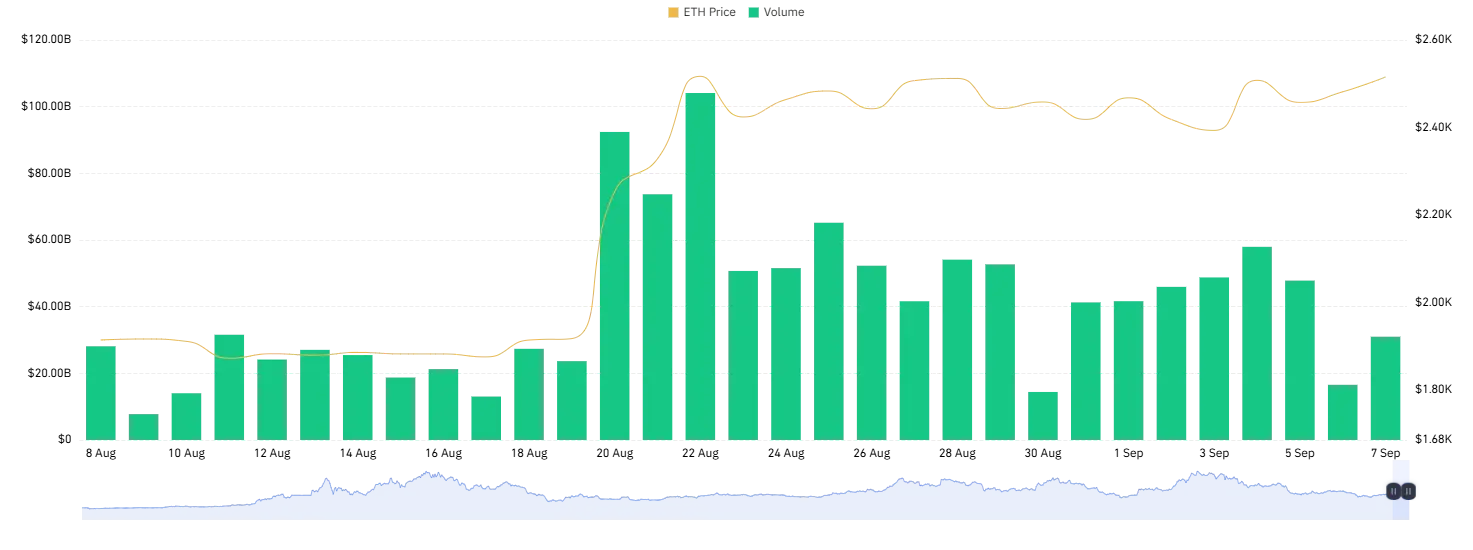
Since then, ETH has been consolidating in the $2,350–$2,550 range, with volume cooling off but staying elevated compared to early August levels. The renewed uptick in volume around September 5–7, alongside price holding firm near recent highs, hints at accumulation rather than distribution. If this pattern continues, ETH could attempt a fresh breakout above $2.500, with the $2,000 zone now acting as a key support floor.
Final Thought
Ethereum’s price action tells a consistent story across every metric: price, Open Interest, and volume are all pointing the same direction. The $2,500 zone is the line in the sand: a daily close above it, backed by rising OI and volume, would confirm fresh capital is entering the market and could set up a move toward $2,800–$3,000. On the other hand, a breakdown below $2,400 with falling OI would suggest traders are unwinding positions, opening the door to a retest of the 200-day EMA and potentially the $1,860 support.
For now, the structure favors buyers: steady OI, healthy volume, and price holding near highs all point to accumulation rather than exit. But until ETH actually clears $2,500 on a closing basis, this remains a “wait for confirmation” setup rather than a guaranteed breakout.
Why did Ethereum’s price halt near $2,500 after such a strong rally?
ETH surged nearly 60% from $1,600 to $2,500 since July, but has struggled to close above $2,500 for 18 days. This is a classic resistance zone test, buyers pushed hard but haven’t yet found enough strength to break through decisively.
What needs to happen for ETH to hit $3,000?
A daily close above $2,500, backed by rising trading volume and Open Interest, would signal fresh capital entering the market. If that breakout holds, ETH could realistically test $2,800–$3,000 in the coming weeks.
What happens if ETH fails to break $2,500?
If Ethereum price closes below $2,400, sellers could gain control, dragging price down toward the 200-day EMA. A break below that level could open the door to the next support at $1,860.