

Gold is a volatile asset and its price gets affected by any news or any geopolitical changes. Gold price has undergone a correction and is trading near the key moving averages. It is defending a support zone and can show a reversal from this zone. Institutions are buying gold which can drive the gold price further.
Gold Price Overview
International Spot Price:
- Spot gold: around $4,344.51 per ounce, down 0.32% on the day, gold trading higher on September 23 as oil prices continued to decline over the past few sessions
- Spot gold price was down by 0.6% to $4,349.94 per ounce, while US gold futures were down by 0.9% to $4,383.90 per ounce
- 1-year change: gold price is up over 35.66% compared to a year ago
MCX (India) Futures:
- October gold futures on MCX rose 0.05% to Rs 1,52,795 per 10 grams on September 23, while September silver futures advanced 0.47%
- MCX gold price had fallen by 0.54% to ₹152,265 per 10g a day earlier, easing after last week’s rally to fresh highs ran into profit booking
Gold price technical analysis over 1-D timeframe
Gold price has undergone a correction phase of 9.90% since late August. It has been hovering around the 100-days and 200-days EMA. Gold price was approaching an immediate support level of $4,235 on a daily timeframe.
If buyers bounce back and manage to defend this support level, it could be a buying signal. If the price action forms any bullish candlestick pattern or if we get a sweep of this zone we might see a buying pressure from here. on this support level on a daily timeframe, buyers might be confident. Once the price surpasses the 200-days EMA on a daily timeframe, the price could extend to the next resistance zone of $4,700.
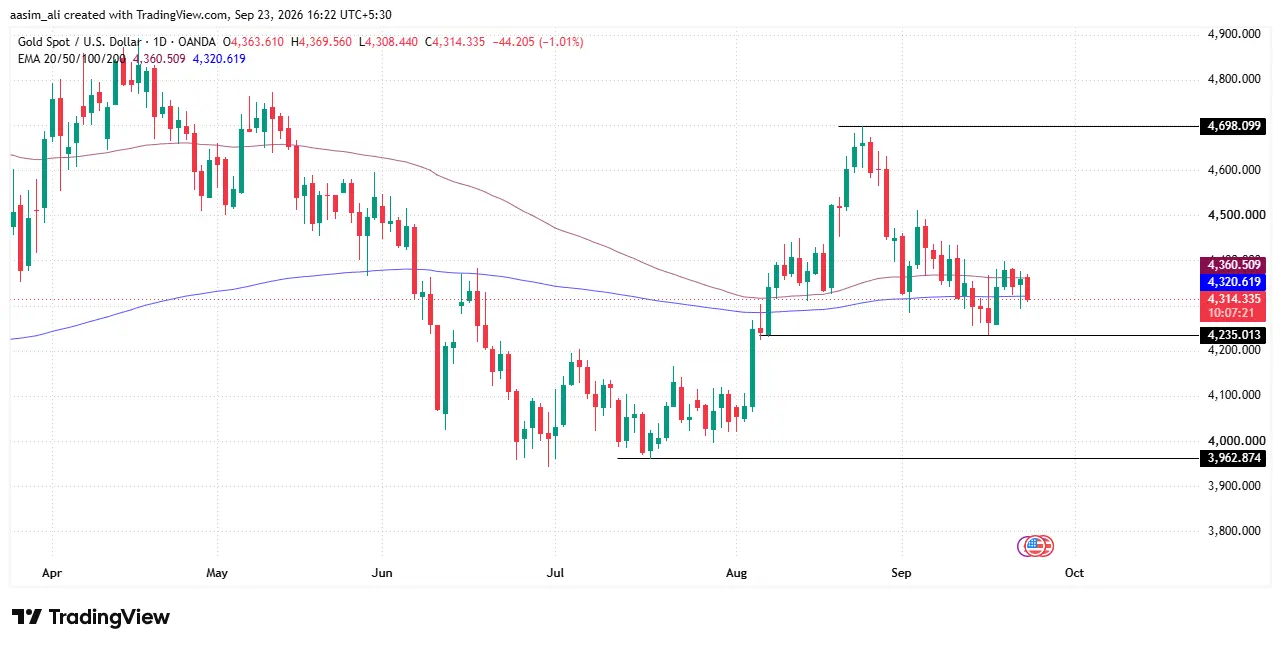
On the other hand, if buyers fail to defend the support level of $4,235 then sellers may dominate further. Losing this support level could attract sellers and Gold price could melt to the next support level of $3,962.
Central Bank Gold Buying: RBI, PBoC & Global Reserve Accumulation
Global trend:
- Central banks have accumulated an average of 1,000 tonnes of gold annually over the past four years, double the 500-tonne yearly average of the preceding decade.
- Central bank gold buying made a strong comeback in Q2 2026 at 289 tonnes, five times the revised Q1 figure and 62% higher than the same quarter last year, marking the highest Q2 figure on record.
- Despite the Q2 rebound, H1 2026 total purchases stood at 345 tonnes, the lowest H1 figure since 2022, after an unusually weak Q1 caused by selling from Turkey, Russia, and Azerbaijan.
- Poland and China led reported purchases in Q2 2026, reflecting continued focus on diversification and protection against geopolitical/financial risk.
- Goldman Sachs forecasts central bank buying will average around 60 tonnes a month through 2026, up sharply from a revised 50-tonne monthly pace in March.
RBI (India):
- RBI’s gold reserves rose from 822.1 tonnes in FY24 to 879.58 tonnes in FY25, edging up further to 880.52 tonnes in FY26
- A key shift is where the gold is stored: about 77.23% (680.05 tonnes) is now held domestically, sharply up from 59.2% a year earlier and just 38% in March 2023, reflecting RBI’s push to reduce reliance on custodians like the Bank of England
- As of May 2026, India’s forex reserves stood at $696.99 billion, with the value of gold holdings climbing to $120.85 billion, boosted by the global price rally
PBoC (China):
- China’s central bank has been a leading buyer alongside Poland in recent quarters, continuing a multi-year reserve diversification push away from the US dollar
Why they’re buying:
- Diversification away from US dollar-denominated reserves.
- Hedge against inflation and currency depreciation.
- Protection against geopolitical risk and sanctions exposure.
- Gold increasingly seen as a growing, strategic share of reserve portfolios rather than a short-term trade, the World Gold Council’s 2026 survey found central banks remain firmly positive on gold, even at elevated prices.
US Federal Reserve Policy & Interest Rates
The Fed funds rate has held at 3.50–3.75% since December 2025, with the FOMC pausing at four straight meetings under new Chair Kevin Warsh. At the June 2026 meeting, the dot plot shifted notably hawkish, most officials leaned toward a possible hike rather than a cut before year-end, while the Fed also raised its inflation projection and trimmed its growth outlook. This unsettled gold, which has slipped from its January record near $5,600/oz. Gold prices react less to the headline decision and more to real yields, Treasury returns after inflation, making Fed guidance the single biggest swing factor for bullion in 2026.
US Dollar Index (DXY) Correlation
Gold and the US Dollar Index share one of the most reliable inverse relationships in commodity markets, a weaker dollar makes gold cheaper for foreign buyers, lifting demand, while a stronger dollar does the opposite. In early 2026, this correlation hit an extreme -96%, among the strongest readings since 1990. More recently, hawkish comments from Fed Chair Kevin Warsh at Jackson Hole pushed front-end Treasury yields higher, reviving DXY strength and pressuring gold into a bearish technical pattern. For Indian investors, rupee depreciation against a stronger dollar adds a second layer, often pushing MCX gold prices higher even when global spot gold is flat.
Inflation Trends & Gold as a Hedge
US inflation data remains a key gold catalyst. The August 2026 CPI print held steady at 3.4% annually, matching forecasts, while core CPI edged up 0.3% month-on-month, slightly hotter than expected. Gasoline and fuel oil costs drove much of the increase, while shelter and food inflation cooled. Sticky inflation keeps the Fed cautious about cutting rates further, which in turn keeps real yields elevated, a headwind for non-yielding gold. However, gold’s traditional role as an inflation hedge means any fresh upside surprise in CPI, or renewed energy-driven price pressure, could quickly reignite safe-haven and hedging demand for the metal.
Geopolitical Tensions & Safe-Haven Demand
Geopolitical risk has been a dominant driver of gold’s 2026 rally. Escalating Middle East tensions, including US-Israel strikes on Iran, pushed gold price to a record high near $5,600/oz earlier this year as investors fled to safety. Retaliatory attacks, disrupted Gulf shipping routes, and fears of a prolonged regional conflict repeatedly triggered sharp bullion rallies. Beyond the Middle East, ongoing US-China trade friction and reserve-currency diversification by BRICS nations have added a structural layer of safe-haven demand. Even as some rallies later reversed on profit-booking or dollar strength, geopolitical uncertainty remains a persistent floor under gold price through 2026.
Demand from India and China
India and China together account for the bulk of global physical gold demand, driven by festivals, weddings, and cultural buying patterns. However, record-high prices have complicated the picture in 2026: India’s gold import duty hike from 6% to 15% is expected to cut jewellery and investment demand by 50–60 tonnes this year, per the World Gold Council. Festive volume has also softened, with demand between Raksha Bandhan and Onam falling sharply year-on-year. Even so, elevated prices have shifted consumer preference toward coins, bars, and digital gold, while central bank and investment buying continue to offset weaker jewellery volumes.
Global Economic Growth Outlook
The IMF has repeatedly revised its 2026 global growth forecast amid Middle East conflict risk, most recently trimming it to 3.1%, down 0.2 percentage points from January projections. In a severe scenario: oil prices surging 100–200% and staying elevated into 2027, global growth could slow to near 2%, a level the IMF calls “a close call for a global recession.” Slower growth and recession fears typically favor gold, as investors rotate out of equities and riskier assets into safe havens. This growth-inflation tension, weak growth alongside sticky inflation, is precisely the environment in which gold has historically outperformed.
Final Thought
Gold’s story in 2026 is really a tug-of-war between two forces: structural demand and near-term monetary tightening pressure. On one side, central banks; led by India, China, and Poland: continue to buy gold at a historic pace, treating it as a permanent strategic reserve asset rather than a trade to be timed. This buying provides a strong long-term floor under prices. On the other side, a hawkish Fed under Kevin Warsh, elevated real yields, and a firming dollar are creating short-term headwinds, which explains the current pullback from January’s record highs.
Technically, the $4,235 support zone is the level to watch. A bounce here, especially with a bullish reversal candle, could open the door back toward $4,700 once gold priclears its 200-day EMA. A breakdown, however, could see prices slide toward $3,962. Given persistent geopolitical risk, sticky inflation, and continued central bank accumulation, the broader trend still favors gold buyers on dips, but near-term volatility around Fed commentary and dollar strength should be expected. Investors would do well to track both the technical support zones and the Fed’s evolving rate-cut/hike stance before making fresh allocation decisions.
Why is the gold price falling despite record central bank buying?
Gold price has corrected nearly 9.90% from its late-August highs mainly due to a hawkish shift in the US Fed’s dot plot, rising real yields, and a stronger US Dollar Index. Even though central banks like RBI and PBoC keep accumulating gold for reserve diversification, near-term price action is more sensitive to Fed policy and dollar strength than to institutional demand.
What is the key support and resistance level for gold right now?
On the daily chart, gold is testing support near $4,235. Holding this level could push prices toward the next resistance at $4,700, once gold clears its 200-day EMA. A break below $4,235 could open the door to a deeper fall toward $3,962.
How does the US Dollar Index (DXY) affect gold prices in India?
Gold and the dollar typically move inversely, a weaker dollar makes gold cheaper for foreign buyers and boosts demand, while a stronger dollar does the opposite. For Indian investors, a stronger dollar also weakens the rupee, which can push MCX gold prices higher even when global spot gold is flat or falling.