

U.S. spot Bitcoin ETFs are back in the spotlight. Trading volume across the funds surged past $5.3 billion on Friday, August 21, 2026, as Bitcoin reclaimed the $74,000 level for the first time in 86 days. That volume spike follows a separate milestone two days earlier: on Wednesday, August 19, the same funds posted their strongest net inflow day in over three months. The two figures measure different things, volume versus net inflows, and happened on different days.
August 21: Spot Bitcoin ETF volume surge led by BlackRock’s IBIT
BlackRock’s IBIT accounted for the bulk of Friday’s activity, posting roughly $4.44 billion in trading volume, about 83% of the total. Fidelity’s FBTC followed at $438 million, with Grayscale at $208.8 million (reported data didn’t specify whether this reflects GBTC, the Bitcoin Mini Trust, or both). The rest was spread across Bitwise, ARK Invest, VanEck, Morgan Stanley, Franklin Templeton, Invesco, Valkyrie, WisdomTree and Hashdex.
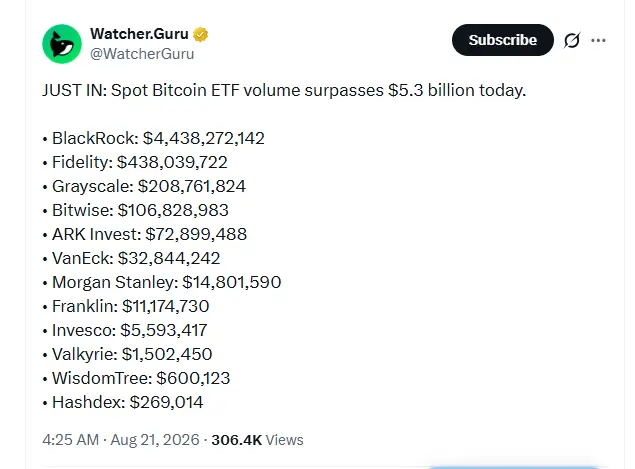 U.S. spot Bitcoin ETF trading volume surpassed $5.3 billion on August 21, led by BlackRock’s IBIT, according to Watcher.Guru.
Volume reflects total shares bought and sold that day, it doesn’t show whether the funds gained or lost assets overall. The clearer read on institutional demand is net inflows, and that figure comes from two days earlier.
August 19: Spot Bitcoin ETF net inflows hit a three month high
U.S. spot Bitcoin ETFs recorded $517.19 million in net inflows on Wednesday, August 19, the largest since May 4. Eight of the 12 tracked funds posted positive flows: IBIT led with $284.74 million, followed by ARKB with $77.71 million, FBTC with $62.41 million, BITB with $35.60 million, GBTC with $21.18 million, Grayscale’s Bitcoin Mini Trust with $19.66 million, MSBT with nearly $10 million and EZBC with $5.92 million..
That session capped a three day run in which the funds absorbed close to $1 billion in net inflows, among the strongest stretches since the products launched in January 2024, and a notable turnaround after a rough first half of 2026 that saw billions in net outflows.By the time Friday’s $5.3 billion volume day arrived, the strong inflows earlier in the week had added to signs of renewed institutional interest as Bitcoin moved toward $74,000.
What’s driving the spot Bitcoin ETF rally
Bitcoin surged roughly 17% over two days, adding around $11,000 to its price and more than $220 billion to its market cap. Catalysts included the U.S. Treasury’s decision to at least double liquidity-support buyback operations for longer dated securities (pushing yields and the dollar lower), the SEC’s latest crypto-related regulatory proposal, and a White House meeting between President Trump and senior crypto executives.
The rally also triggered a significant short squeeze. CoinGlass data showed roughly $2.75 billion in Bitcoin short liquidations on August 19, part of a broader reported total exceeding $3.6 billion across a 72-hour window. A further $783.2 million in Bitcoin positions were liquidated over the following 24 hours, $747.7 million of it from shorts. These are rolling CoinGlass snapshots, so exact totals can shift depending on the measurement window.
Spot Bitcoin ETF inflows in historical context
The August 19 session, while the strongest in months, sits well below the all-time records for single-day net inflows. Multiple independent reports (Bloomberg, CoinDesk, The Block) point to November 7, 2024 as the largest on record at roughly $1.37 billion, the day after Trump’s election win, with IBIT alone pulling in $1.11 billion. October 6, 2025 produced the second-largest day reported at the time, about $1.21 billion, as Bitcoin hit an all-time high near $126,000. Several other sessions, including March 12, 2024 and back-to-back days in November 2024, also crossed $1 billion; these figures can see minor revision after initial reporting.
Analysts note a pattern: past $1 billion-plus inflow days have often coincided with short-term price tops rather than the start of extended rallies, making the size of an inflow day one signal among several, not a standalone buy signal.
Not everyone is convinced
Bloomberg’s Mike McGlone remains skeptical, calling the move “a bounce within the purge” and noting August can produce sharp short squeezes even within a broader bear market. He cited Bitcoin’s volatility and equity correlation as unfavorable for institutional risk-reward, and pointed to rapid growth in the wider crypto market as a source of excess supply. He suggested Bitcoin could roll over again by year-end, while remaining supportive of blockchain technology broadly.
The bigger picture for Spot Bitcoin ETF demand
Net inflows into a spot Bitcoin ETF typically require the issuer to buy and hold additional Bitcoin to back new shares, mechanically tightening available supply, though the exact timing and structure of those purchases can vary by fund. That’s the general channel through which ETF demand feeds into price. With IBIT and FBTC continuing to dominate flows, Bitcoin ETF demand remains concentrated in a small number of vehicles, even as the broader trend suggests institutional capital is cautiously re-engaging with Bitcoin through regulated, traditional-finance channels.
What is the difference between Bitcoin ETF trading volume and net inflows?
Trading volume represents the total value of ETF shares bought and sold during a given period, while net inflows represent the net amount of new capital entering the funds after accounting for outflows and redemptions.
What is the difference between Bitcoin ETF trading volume and net inflows?
What is the difference between Bitcoin ETF trading volume and net inflows?
Trading volume represents the total value of ETF shares bought and sold during a given period, while net inflows represent the net amount of new capital entering the funds after accounting for outflows and redemptions.
How much did spot Bitcoin ETFs receive in net inflows on August 19?
U.S. spot Bitcoin ETFs recorded approximately $517.19 million in net inflows on August 19, marking their strongest single-day inflow in more than three months.