
Solana price has witnessed a strong bullish week of 2026. The price has surged by 68% in the past 3 months and has dominated key moving averages. SOL price has reached the psychological level of $100 and has triggered a breakout from a major resistance zone. However, Open Interest has also increased which could impact the price.
Solana (SOL) price overview
At press time, Solana price was trading at $103.21 with an intraday loss of -1.4%. It has a market capitalization of $60.385B and the 24-hour trading volume is $3.655B. Solana ranks 7th in the crypto market based on the market valuation.
Solana price shows bullish sign: Can it trigger another bullish rally?
In early 2025, SOL price was trading just below the $300 territory. However market conditions some High open interest from Longs and economic condition let sellers dominate the price and from the top zone Solana started facing huge resistance and price fell upto 60$ by 2026 . Now Sol made a base around 60$ and After being in accumulation for certain weeks buyers now started the price pulling UL.
Since February 2026, the price was struggling below a major resistance level of $98. However, buyers have bounced back and have managed to trigger a breakout from this resistance zone amid the BTC rally.
Solana price has experienced 36% gain in the past 2 weeks. Amid this bullish trend, the price reached $110 mark but has shown profit booking. Solana price has dropped by 7.22% due to profit booking. After the profit booking, the price was still trading over the $98 mark at press time and has entered the pullback territory.
If buyers bounce back then this fall could turn into a pullback. If the chart structure manages to form a pullback on a daily timeframe and surpasses previous high of $100, buyers might be confident. Here, BTC movement could matter because most of the altcoins movement depends upon the BTC price behavior. If the Open Interest increases during the pullback, the price may trigger a bullish rally and can extend to the $150 mark.
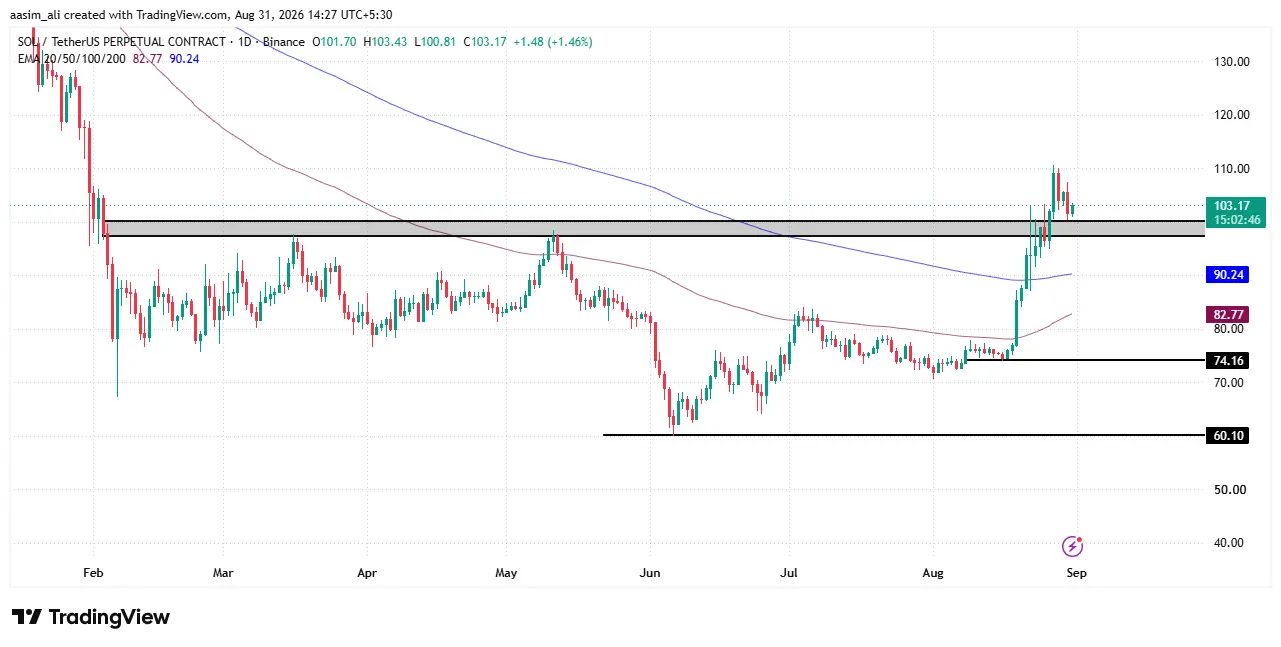
Conversely, if buyers fail to sustain over the $98 mark then most of the traders and investors may prefer to book profit. If the profit booking occurs in this zone then the price may melt to the 200-days EMA on a daily timeframe. Once the price slips below the 200-days EMA, the price may drop to the next support level of $74.
Solana price and Open Interest (OI) data for August
Looking at the chart, SOL price stayed range-bound between roughly $70 and $74 for most of the first three weeks of August, while Open Interest (OI) held steady around $4.5B–5B, a classic consolidation phase with no strong directional conviction from derivatives traders.
The real shift started around August 19–20, when price broke out sharply from $77 to $95 in just a few days. Crucially, OI expanded in tandem, jumping from $5B to nearly $6B and eventually peaking above $7.60B by August 28, alongside the price high of $108–109. This is a healthy bullish signal, rising price with rising OI usually means fresh long positions (long and short) are entering the market, not just short-covering.
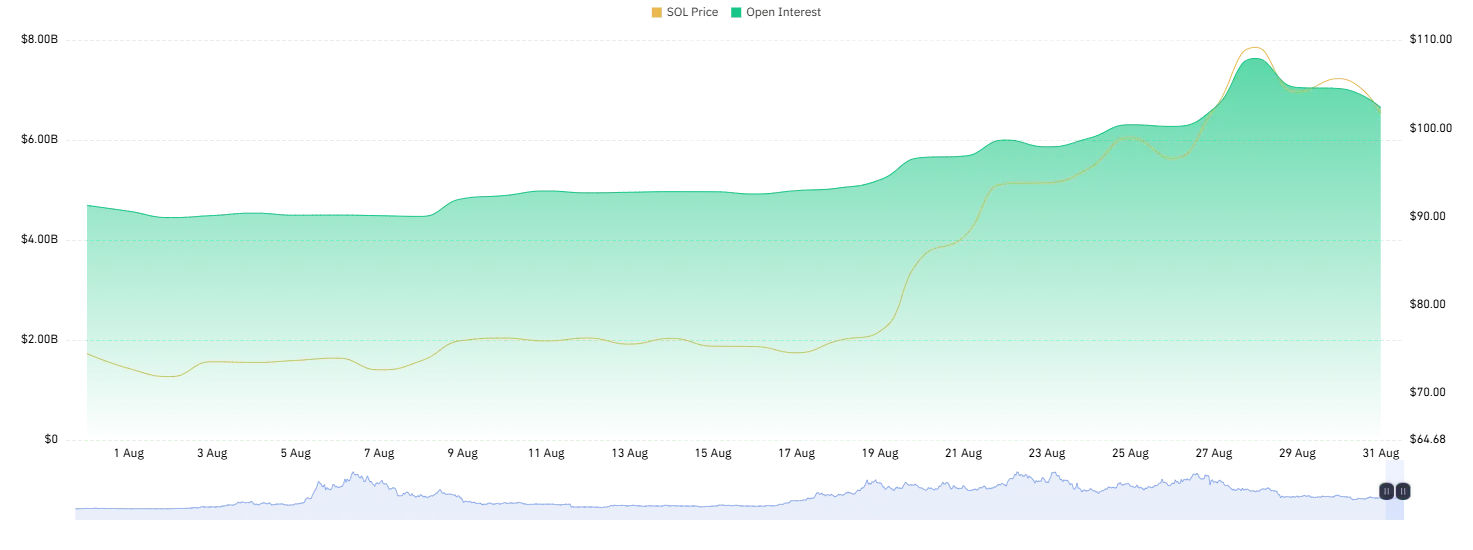
However, near the very end of the month, both price and OI have started rolling over together, price pulled back to $103–104 and OI eased to $6.8B. This synchronized pullback suggests some long positions are being unwound/profit-booked rather than aggressive new shorting (which would typically show OI rising while price falls).
Solana perpetual liquidation
SOL’s liquidation data reveals a leveraged but genuinely bullish uptrend rather than a smooth rally. From late July to mid-August, liquidations stayed minimal as price traded flat near $68 to $72, showing low conviction. On August 19-20, a massive short liquidation ($95M) triggered a short squeeze, propelling price sharply higher. This was followed by a large long liquidation ($95M) on August 21 as late buyers who chased the pump got flushed out during consolidation.
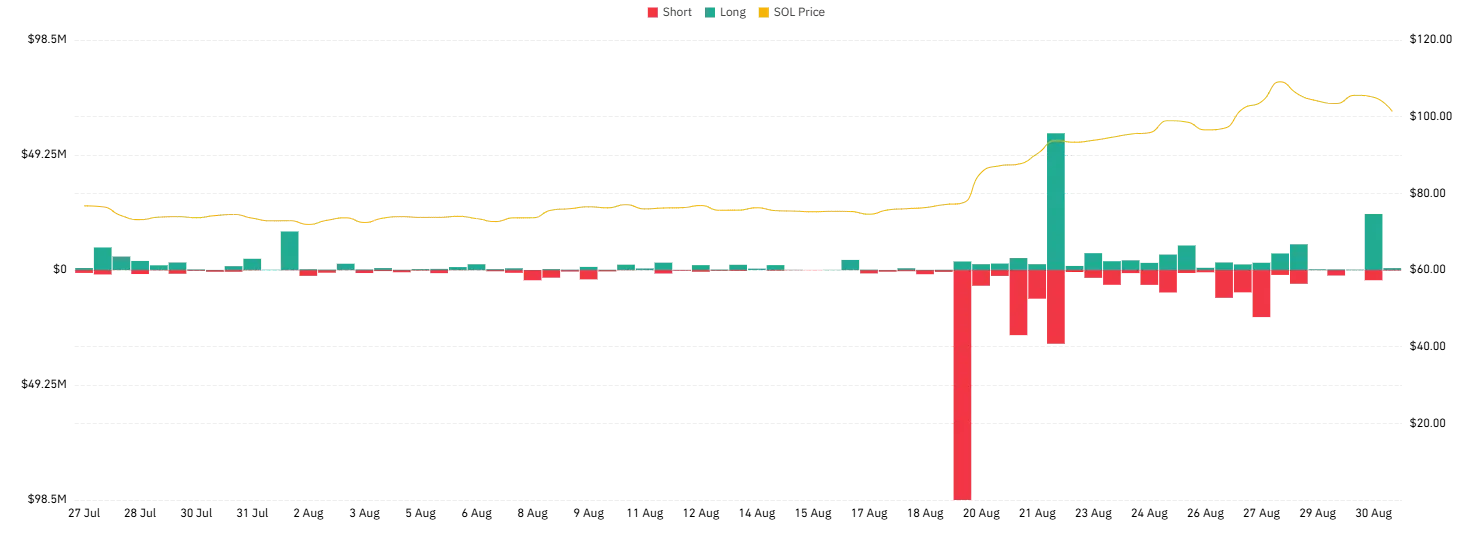
Between August 23-27, moderate short liquidations continued even as price climbed toward $100+, suggesting shorts kept fading the rally and getting squeezed, reinforcing bullish momentum. By August 30, another notable long liquidation ($70M) appeared near the highs as price dipped slightly from $108 to $103, signaling over-leveraged longs being shaken out. This pattern points to continued volatility: another short squeeze could push prices higher, but persistent long exhaustion near highs may trigger consolidation or a pullback before SOL’s next decisive move.
Solana tokenomics
Solana’s token economics model is designed to balance network security, decentralization, and sustainable growth. Unlike Bitcoin’s fixed supply model, Solana implements a disinflationary approach where initial token emission starts higher and gradually decreases over time according to a predetermined schedule.
The Solana token serves multiple purposes within the ecosystem. It acts as a medium of exchange for transaction fees, participates in network security through staking, and provides governance rights for protocol decision-making. This multi-utility design creates natural demand for SOL that helps offset the inflationary aspects of new token issuance.
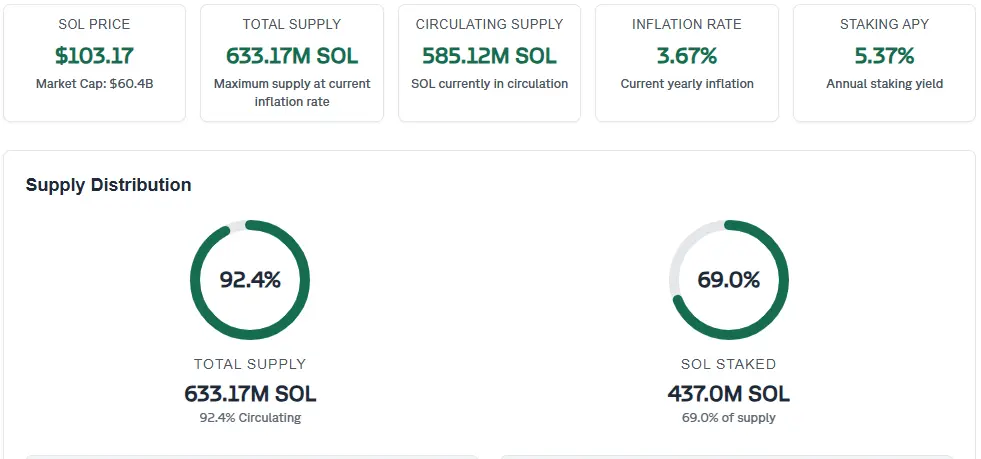
Solana currently trades at $102.35, giving it a market cap of $59.9B. Its total supply stands at 633.17M SOL, the maximum issuable under the current inflation schedule, while circulating supply is 585.12M SOL, meaning 92.4% of total supply is already in circulation. The network’s yearly inflation rate is 3.67%, which gradually adds new SOL to supply over time.
On the staking side, 437.1M SOL is currently staked, representing 69% of total supply, earning stakers an annual yield of 5.37%. This high staking ratio reflects strong network security and investor confidence, while the near-fully-circulating supply suggests limited future dilution pressure compared to earlier-stage crypto assets.
Final Thoughts
Solana’s price action reflects a healthy, leverage-driven uptrend rather than a fragile pump. Rising price alongside rising Open Interest through August confirmed genuine long positioning, while repeated short squeezes reinforced bullish momentum. The current pullback toward $102-104, accompanied by cooling OI, looks more like profit-booking than a trend reversal. Holding above the $98 support will be key, a breach could send SOL toward the 200-day EMA and then $74. On the upside, a confirmed pullback with rising OI could reignite momentum toward $150. Strong fundamentals, 69% staked supply and near-full circulation, add further long-term support to SOL’s structure.
Why did Solana’s price pull back after hitting $110?
After a strong rally, SOL faced profit booking near the $110 mark, causing a 7.22% drop. This is common after a sharp breakout, as early buyers lock in gains before the next move.
What does rising Open Interest alongside price mean for SOL?
When Open Interest and price rise together, it typically signals fresh long positions entering the market rather than short-covering, a healthier, more sustainable bullish signal than a rally driven purely by squeezed shorts.