

BitMEX co-founder Arthur Hayes has made another move on ETH, purchasing 1,332.5 ETH worth $2.53 million today, according to on-chain data shared on X. The buy extends his recent accumulation streak and reignites the conversation around institutional demand for ETH.
“In June, Hayes sold 6,000 ETH at a loss of nearly $606,000. By July, he had reversed course, buying back in through a series of purchases, even as the market debates Ethereum’s role in the next bull run.”
Arthur Hayes extends a pattern of Ethereum accumulation
The latest purchase extends Hayes’ return to Ethereum, which began earlier this month when he acquired around 1,939 ETH across two OTC-style transactions. That buying spree marked a reversal just weeks after he exited his ETH position at a loss in June.

Source: X
Hayes has faced criticism for a recurring pattern: publicly endorsing tokens like HYPE, ZEC, and WLD, then exiting those positions quietly once prices moved. Ether, meanwhile, is holding at $1,906, up 1.74% in the last 24 hours with its market cap sitting above $230 billion.
Ethereum staking ratio hits all-time high of 33% as institutional adoption accelerates
Growing whale accumulation around ETH is fueling talk of a shift in Ethereum’s bull case, from crypto-native speculation toward institutional adoption. Bitmine Immersion Technologies Chairman Tom Lee argues Wall Street, not retail traders, is now the driving force behind ETH’s growth, pointing to BlackRock’s tokenized BUIDL fund and Robinhood Chain’s use of ETH as a gas token as key signals.
The staking data backs this thesis. Ethereum’s staking ratio crossed an all-time high of 33% at the end of June, according to CryptoQuant. BlackRock played a role in driving that shift, having launched the iShares Staked Ethereum ETF, which locks the bulk of its holdings into staking contracts.
Institutions and ETFs already held more than 9% of Ethereum’s total supply as of last year, and that share has likely climbed further since. Around the same time, Standard Chartered’s Geoff Kendrick argued that ETH treasuries rank among the strongest institutional crypto trades on offer, pointing to staking yield and stronger relative valuations compared with Bitcoin and Solana treasury vehicles.
Ethereum price overview
ETH crypto price was trading at $1932.95 with an intraday gain of 3.53%. It has a market capitalization of $233.27B and the 24-hour trading volume is $13.07B.
ETH is the 2nd largest cryptocurrency in terms of market capitalization. The total supply and circulation supply is 120.68M ETH.
Ethereum price has started recovering from the bottom. It has triggered a pullback and has reached the key moving average.
Ethereum price formed a bullish pattern, Can it skyrocket soon?
ETH price has formed a double bottom pattern on the daily timeframe near the $1,500 level and has since bounced back. Amid this bullish move, investors have increased their holdings by 24% in the last 20 days.
However, ETH price faced resistance near the 100-day EMA, triggering a pullback, and is currently trading below this key moving average.
Once ETH price manages to surpass the 100-day EMA, buyers may set their sights on the 200-day EMA next. Additionally, there is a major resistance zone near $2,400. If the price breaks above this level with strong volume, the trend could flip bullish.
Meanwhile, the RSI has formed a bullish divergence, which could fuel upward momentum.
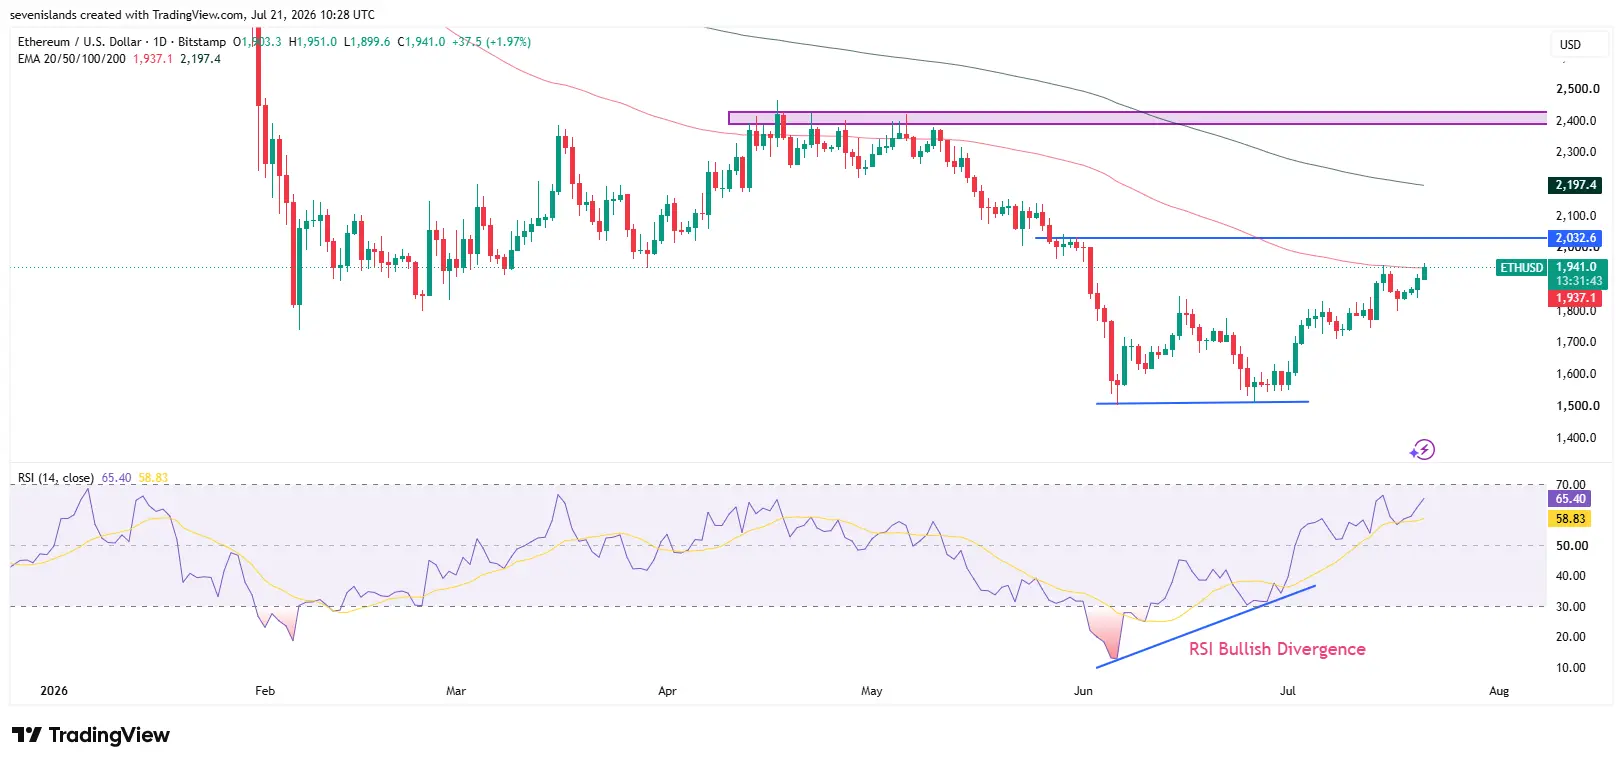
Source: ETH/USDT 1-D Chart by TradingView
Conversely, if the asset price remains below the 100-day EMA, sellers may retain control. The price could face resistance near the immediate resistance zone of $2,035, and if the asset forms a bearish candlestick pattern, another bearish move could follow.
On a smaller time frame, the price has grabbed liquidity from the recent high. This could lead to a short-term bearish move.
Final Thoughts
Arthur Hayes’ renewed Ethereum accumulation, coming just weeks after he booked a loss exiting his position, adds another data point to the broader institutional narrative building around ETH. With the staking ratio at an all-time high, institutions and ETFs holding a growing share of supply, and voices like Tom Lee and Geoff Kendrick pointing to structural demand from Wall Street, the case for ETH’s role in the next cycle looks increasingly tied to on-chain fundamentals rather than pure speculation.
That said, price action tells its own story for now. ETH is trading around $1,932.95 (approximately ₹1,61,500 at current exchange rates), still below its 100-day EMA, with $2,035 and the $2,400 zone standing as the next hurdles to watch. A confirmed breakout above these levels on strong volume could validate the bullish divergence forming on the RSI, while a rejection here would keep sellers in control.
Whether ETH leads the next bull run will likely depend on whether this institutional demand translates into sustained price strength above these key resistance zones, not just accumulation headlines. As always, crypto markets remain volatile, and price predictions should not be taken as financial advice. Investors are encouraged to do their own research before making trading decisions.
Why is Arthur Hayes buying Ethereum again?
Arthur Hayes has resumed accumulating ETH after exiting his position at a loss in June, purchasing over 3,271 ETH across multiple transactions this month, including the latest $2.53 million buy.
What is driving institutional demand for Ethereum?
Institutional interest in Ethereum is being fueled by staking yield, tokenization use cases like BlackRock’s BUIDL fund, and ETH’s role as a gas token for platforms like Robinhood Chain.
What happens if Ethereum fails to hold above key support levels?
If Ethereum price remains below the 100-day EMA, sellers may retain control, with resistance likely near $2,035. A bearish candlestick pattern at this level could trigger another downward move toward previous support zones.