

Ethereum is increasingly attractive from a valuation standpoint, particularly relative to Bitcoin, but on-chain data suggests the market has yet to reach a definitive cycle bottom, according to CryptoQuant.
Ethereum has declined more compared to Bitcoin. However, ETH has recovered more. It has shown sharp recovery and has surpassed the psychological level of $2,000. It has surpassed the 100-days EMA but Bitcoin is yet to do so. Meanwhile, ETH has recovered more as compared to BTC from the bottom.
Ethereum and Bitcoin: price action
Both Ethereum and Bitcoin faced heavy selling pressure starting August 2025. Amid that downtrend, ETH lost 60.33% and BTC lost 48.35% from their respective all-time highs.
Since then, both assets have reversed course and regained bullish momentum. From their recent swing lows, BTC is up 12.57% while ETH has surged 30.05%, signaling that Ethereum is currently outperforming Bitcoin.
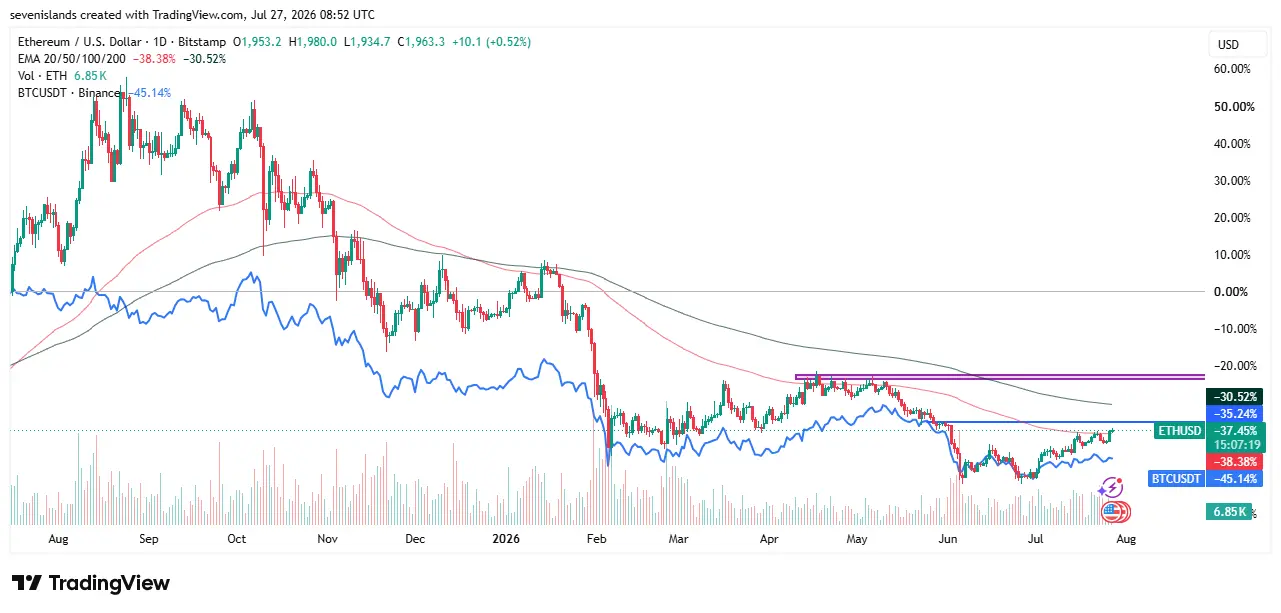
Source: ETH & BTC price 1-D chart by TradingView
On the charts, Ethereum has stayed bullish over the past few weeks and pushed past its 100-day EMA after a brief pullback. That pullback could now attract fresh buying, potentially lifting price toward the 200-day EMA next.
Bitcoin has also held a bullish structure in recent sessions, but without the same aggressive buying seen in Ethereum, BTC hasn’t yet reached its own 100-day EMA.
Is Ethereum near a market bottom against Bitcoin?
Ethereum is becoming increasingly attractive from a valuation standpoint, particularly relative to Bitcoin though on-chain data suggests the market hasn’t reached a definitive cycle bottom yet, according to CryptoQuant.
In its latest weekly report, the analytics firm noted that ETH is trading roughly 17% below its realized price (the average on-chain acquisition cost of all ETH in circulation), currently estimated at around $2,300. Historically, ETH trading below its realized price has coincided with periods of market undervaluation and long-term bottoms.
ETH is also showing strength relative to BTC on several fronts, according to CryptoQuant:
- Its market value-to-realized value (MVRV) ratio has pulled back from extreme overvaluation levels
- Exchange inflows have declined
- ETF holdings have started recovering after months of weakness
- ETH/BTC spot trading volumes have dropped into a range historically associated with market bottoms
On-Chain metrics signal growing investor confidence
Ethereum has flashed several bullish on-chain signals over the past month, pointing to strengthening investor conviction.
In the week starting June 29, ETH withdrawals from Binance, the world’s largest exchange by trading volume, surged to their highest level in over three years. Analysts typically read sustained exchange outflows as investors moving assets into self-custody or staking rather than holding them for quick liquidation. That said, outflows alone don’t guarantee long-term accumulation; some ETH could simply be moving between platforms or into cold storage temporarily.
Adding to the bullish picture, data from Staking Rewards shows that a record 34% of Ethereum’s circulating supply is now staked. As more ETH gets locked into staking contracts, the tradable supply on exchanges shrinks, a dynamic that could ease selling pressure and support prices if demand holds steady.
Institutional appetite is also on display. Tom Lee’s Bitmine Immersion Technologies, currently the largest corporate holder of ETH, added 325,000 ETH to its treasury over the past month even while sitting on substantial unrealized losses. The firm has publicly stated its ambition to eventually control 5% of Ethereum’s total supply, underscoring long-term conviction that goes beyond short-term price swings.
Final thoughts
Ethereum’s recent outperformance against Bitcoin, up 30.05% from its swing low compared to BTC’s 12.57%, points to a shift in relative strength that traders will want to watch closely. The technical setup looks constructive, with ETH already clearing its 100-day EMA while BTC lags behind. On-chain data adds further weight to the bullish case: record staking participation, rising exchange outflows, and continued accumulation by large holders like Bitmine Immersion Technologies all suggest growing investor conviction in ETH’s medium-term prospects.
That said, CryptoQuant’s own analysis stops short of confirming a definitive cycle bottom for ETH against BTC. ETH trading below its realized price of around $2,300 (approximately ₹1.92 lakh at current exchange rates) is historically a sign of undervaluation, but historical patterns don’t guarantee repeat outcomes. Metrics like exchange outflows can also be misread, since some of that ETH may simply be moving between platforms rather than being locked away for the long term.
For traders and investors tracking the ETH/BTC pair, the coming weeks could be telling. A sustained move toward the 200-day EMA, coupled with continued staking growth and ETF inflow recovery, would strengthen the bottoming thesis. Until then, the setup remains promising but unconfirmed.
Is Ethereum forming a market bottom against Bitcoin?
On-chain data from CryptoQuant suggests Ethereum is showing signs of undervaluation relative to Bitcoin, but the firm hasn’t confirmed a definitive cycle bottom yet.
Why is Ethereum outperforming Bitcoin right now?
From their recent swing lows, ETH has surged 30.05% compared to BTC’s 12.57% gain. Ethereum has also broken past its 100-day EMA, while Bitcoin has yet to reach the same technical milestone, reflecting stronger near-term buying momentum in ETH.
How much of Ethereum’s supply is currently staked?
A record 34% of Ethereum’s circulating supply is now staked, according to Staking Rewards. This reduces the tradable supply available on exchanges, which can ease selling pressure and support prices if demand remains steady.