

For months, $80,000 stood like an invisible wall for BTC, a level it couldn’t break. Then, in a single week, everything changed. This massive bullish momentum indicates that whales and institutions are leading the trend. What followed was one of Bitcoin’s sharpest reversals in nearly three years: a 24-27% surge that shattered the $80,000 ceiling for the first time since mid-May. Was this just another short squeeze, or the start of something bigger?
Bitcoin (BTC) price overview
At press time, BTC price was trading at $80,632.00 with an intraday gain of 4.6%. Its market capitalization has increased to $1.618T and the 24-hour trading volume is $56.752B with the current BTC dominance is 60.26%.
How Bitcoin crossed $80,000 after a pullback?
In a 4-H timeframe, the price has experienced strong buying pressure. However, this bullish trend failed to touch the $80K mark in the first attempt. BTC price experienced mild selling pressure of around 3% on Saturday and Sunday which came due to the weekend.
Amid this fall, the price slipped below the $76,000 level (on 23rd August) and whipped out buying positions worth $750,000,000. This fall came during weekends because maybe whales were not operating. On Monday, whales bounced back and led the trend to $80,000.
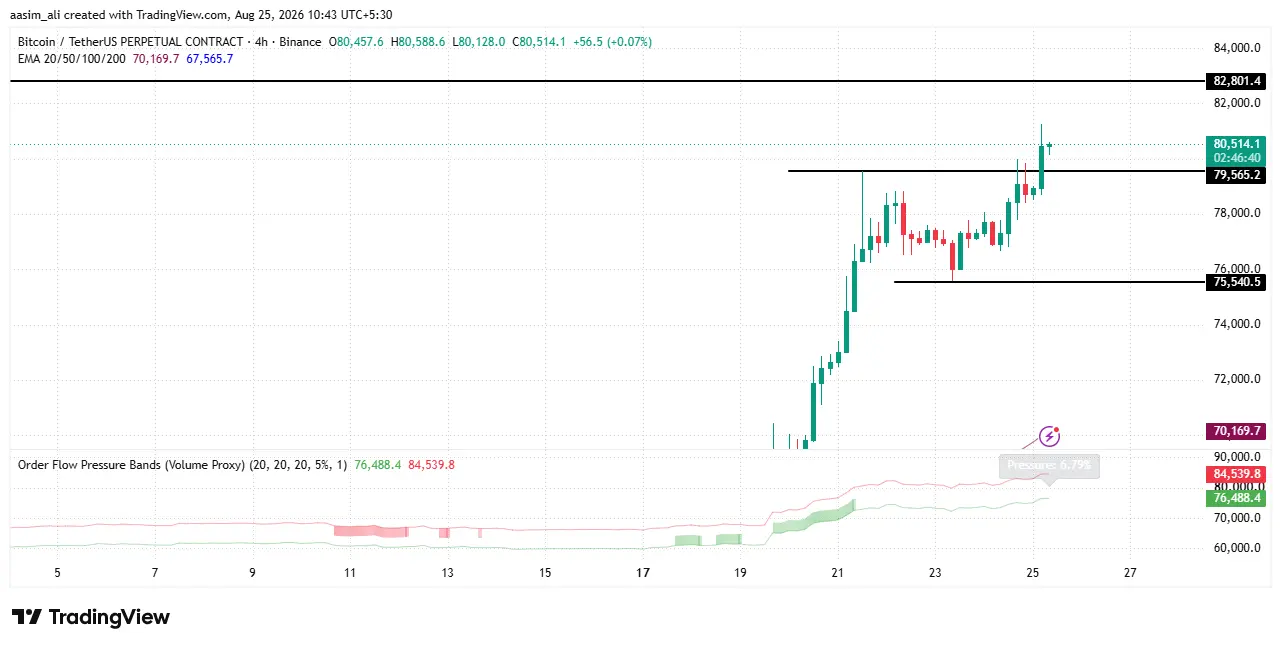
This liquidity sweep helped institutions and whales to fill their huge orders. As these orders got absorbed by the huge pending buying orders, the BTC price triggered a bullish momentum. This buying pressure fueled the momentum and pushed it over the $80,000 level.
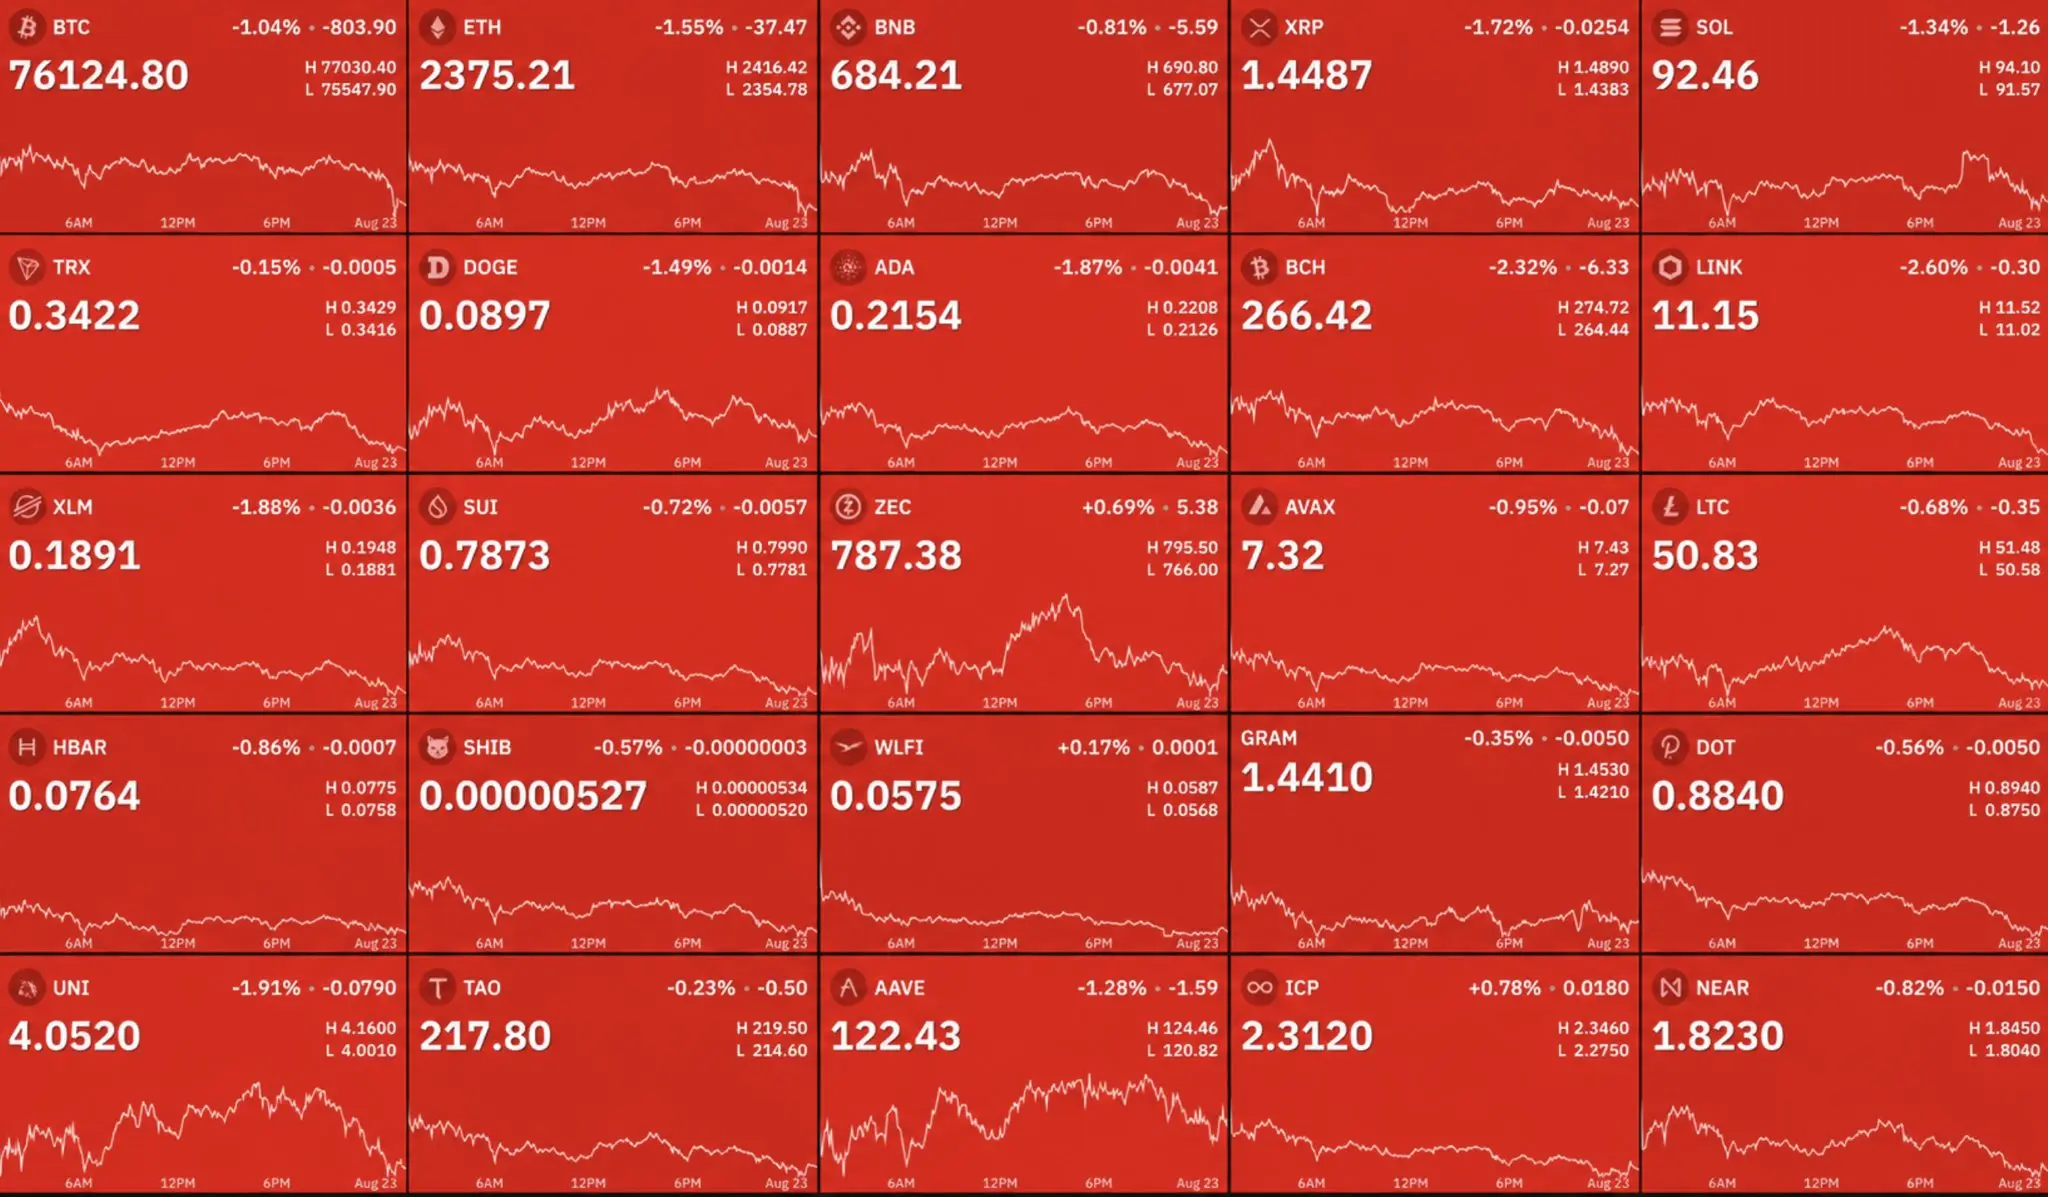
In the beginning of this bullish trend, short liquidation of $4B was seen which helped to trigger this bullish rally.
Bitcoin price analysis based on technical chart
The chart structure of Bitcoin displays that the price has gained a bullish rally after a long consolidation phase of 75 days (from June to mid-August). Amid this bullish trend, the price has crossed the psychological level of $80,000 and is heading toward the May, 2026 high.
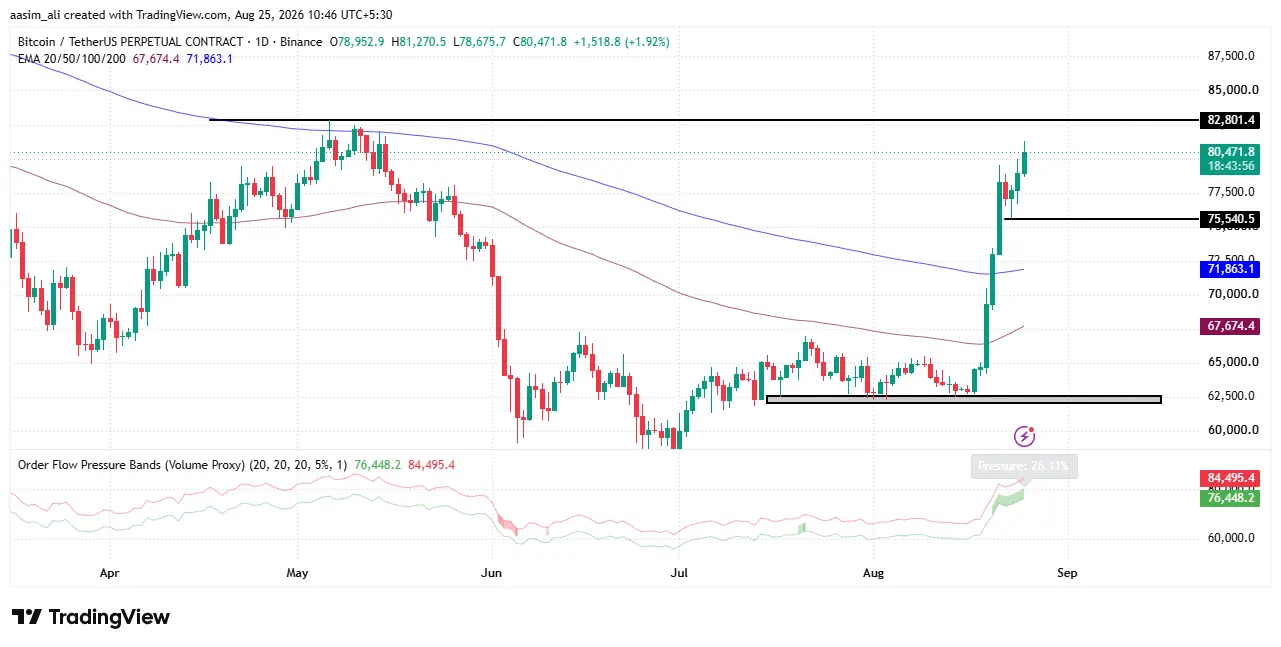
BTC price was trading over the key moving averages which showcases the buyers’ domination. This bullish rally could be disrupted near $82,800, as the price previously faced resistance from the 200-day EMA before the bearish trend began.
Few traders and investors might prefer to book profit in this territory. If the price forms any bearish candlestick pattern in this zone, profit booking on a higher level can be seen. This profit booking could result in a strong selling pressure. Once the price slips below the 200-days EMA, sellers will take the charge and would lead the trend further.
Conversely, if buyers manage to dominate this zone then it could be a sign of another bullish rally. If the price starts trading over the $82,800 zone, buyers might be confident and would try to push the price to the next resistance level of $97,800.
Reasons behind Bitcoin Jump?
Bitcoin crossed $80,000 (its first time back at this level since mid-May) as part of a sharp weekly rally, one of the strongest weekly gains in about three years, with prices up roughly 24-27% in a single week. Here’s what’s driving it:
- US Treasury bond buybacks easing yields
The US Treasury stepped up long-term bond buybacks in mid-to-late August, with Secretary Scott Bessent signaling the program could expand further. This helped lower bond yields and weaken the dollar, while simultaneously pushing gold prices higher, a weaker dollar and lower yields typically push investors toward risk assets like crypto. - Strong spot Bitcoin ETF inflows
Spot Bitcoin ETFs pulled in approximately $1.9 billion during the week of August 17-21 alone, with single-day inflows topping $600 million at certain points, building on the prior month’s roughly $2 billion in weekly inflows, showing accelerating institutional demand rather than a one-off spike. - Massive short liquidations
A wave of institutional buying combined with about $4 billion in forced short closures pushed Bitcoin back above this key psychological threshold, amplifying the upward move as leveraged bearish bets got squeezed out. - Reclaiming a key technical/psychological level
The move ended a prolonged stretch of sideways and downward trading that had kept Bitcoin well below its all-time highs, and it came fast enough to catch a significant portion of the market leaning the wrong way. $80K had acted as resistance since a May peak, so breaking it is seen as technically significant. - Anticipation of further catalysts
Markets are also watching for potential passage of the CLARITY Act (crypto market-structure legislation) in September, and the Fed’s September 15-16 FOMC meeting, a rate cut there could extend the rally further.
Final Thoughts
Bitcoin’s break above $80,000 looks less like a random spike and more like a confluence event, a liquidity sweep that flushed out weak hands, followed by institutional and whale buying that turned a potential breakdown into one of the sharpest reversals in years. The scale of the move (24-27% in a week) combined with hard demand signals like ETF inflows and short liquidations suggests this wasn’t purely sentiment-driven speculation.
That said, the $82,800 zone (the 200-day EMA) is the real test. This is the same level that rejected price before the last bearish leg started, so how BTC behaves here will likely determine whether this is the start of a fresh leg toward $97,800 or just a strong relief rally within a longer consolidation. Traders should watch for confirmation, a clean close above 200-EMA with sustained volume, rather than assuming the breakout is done.
Why did Bitcoin cross $80,000?
Bitcoin’s jump was driven by a combination of factors: a liquidity sweep that flushed out over $750 million in sell positions, strong spot Bitcoin ETF inflows ($1.9 billion in a week), nearly $4 billion in short liquidations, and macro tailwinds like easing US bond yields and a weaker dollar.
Is this a short squeeze or the start of a bigger rally?
It shows signs of both. The initial move was amplified by forced short liquidations (a squeeze), but sustained institutional buying via ETFs and whale accumulation suggests deeper demand rather than a one-off spike. Confirmation will depend on whether BTC holds above the $82,800 resistance zone.
What is the next resistance level for Bitcoin after $80,000?
The next key level to watch is around $82,800, which aligns with the 200-day EMA, a zone that previously triggered a bearish reversal. A confirmed break above this could open the path toward $97,800.
What could cause Bitcoin to reverse from here?
If BTC forms a bearish candlestick pattern near $82,800 and fails to hold above the 200-day EMA, profit-booking and renewed selling pressure could follow, potentially dragging the price back down.