
Bitcoin bottom signal speculation has been the main topic of discussion in crypto as 2026 unwinds, with BTC trading lower for months. As of June 30, 2026, BTC is trading around $59,178.29, down about 5.17% in the past week. Spot Bitcoin ETFs are on pace for their worst month of redemptions on record, with nearly $6 billion flowing out in June alone. Against this backdrop, investors are desperately searching for a reliable signal that tells them whether the worst is finally over or whether more pain lies ahead.
The industry’s most influential voices, from Jan3 CEO Samson Mow to BitMEX co-founder Arthur Hayes, are now publicly arguing on exactly that question, while on-chain data adds yet another layer to the debate.
What is Samson Mow’s Bitcoin bottom signal?
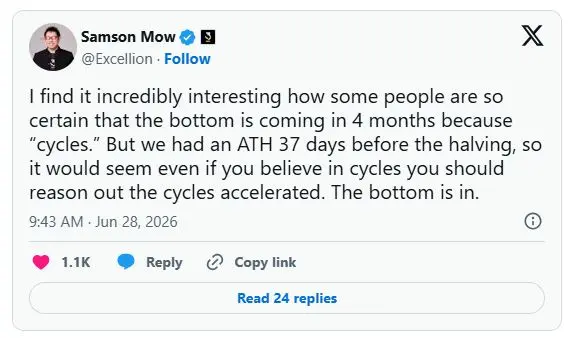
On June 29, 2026, Jan3 CEO Samson Mow declared on X that Bitcoin bottom is already behind the market, a claim that immediately drew attention given how far BTC has fallen from its October 2025 peak of $126,000. Mow’s reasoning is structural rather than emotion based, and it is anchored in a data point that no other analyst seems to have mentioned: every prior halving cycle saw BTC find its all-time high well after the supply cut, but in the current cycle BTC reached its pre-halving peak a whole 37 days before the supply cut actually occurred in mid-April 2024.
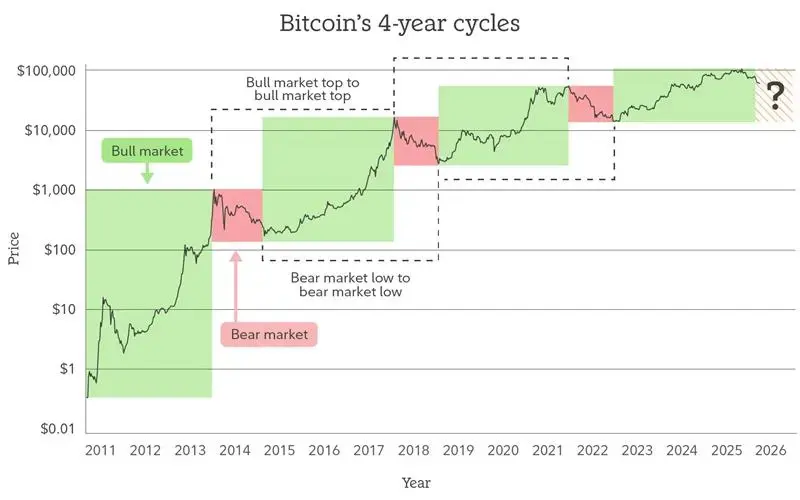
Mow says this means the usual 4-year cycle has collapsed, and the timeline for the cycle low has shortened along with it. That is no small assumption on Bitcoin bottom signal, as Mow’s past work – as the former chief strategy officer at Blockstream and the architect of El Salvador’s Bitcoin treasury strategy – lends him strong credibility as a cycle theorist. He has on occasions been wildly theoretical (notably suggesting Bitcoin could approach $1.33 million this decade’s end), but he has never been erratic while predicting a price frame from which BTC would bide its time, so it is difficult to argue against his logic.
The institutional backdrop makes it all more plausible: the January 2024 launch of US spot Bitcoin ETFs simply didn’t exist during earlier corrections, so people may be very much missing a native structural buying force.
Why do other analysts doubt this Bitcoin bottom signal?
Not everyone believes Mow’s Bitcoin bottom signal for its accelerated-cycle theory, and the disagreement among credible analysts spans a wide $15,000 price range. Four main perspectives are:
- Markus Thielen of 10x Research sees a floor near $55,000. His bottom window runs between August and October 2026
- Arthur Hayes of BitMEX expects a drop toward $40,000 soon. That implies roughly 33% further downside from current price
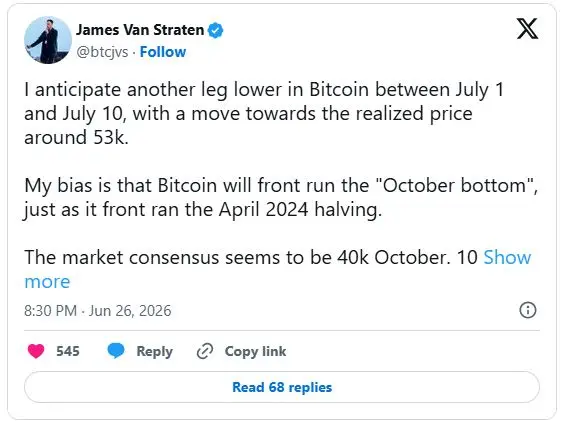
- James Van Straten of CoinDesk flags an unbroken historical pattern. Bitcoin has never bottomed without trading below realized price
- Peter Schiff dismisses this Bitcoin bottom signal as wishful thinking entirely He frames BTC as a high-beta risk asset still.
In other news, analyst Omkar Godbole has also said that there is an upcoming “bearish cross” between Bitcoin’s 50-week and 100-week moving averages, which could indicate more downside in the territory.
Is there an on-chain Bitcoin bottom signal confirmation worth watching?
Beyond the war of opinions, on-chain data is now offering its own version of confirmation. On June 29, 2026, CryptoQuant contributor Darkfost highlighted that the UTXO Block Profit/Loss Count Ratio, a measure of the net ratio of Bitcoin transactions being finalized at profit versus those at loss, has dipped into a range associated with capitulation in a down market.
Darkfost’s analysis says this is the first time that this particular “Capitulation Index” has popped this high since the current correction began, and that capitulation now may finally be a reality. That’s because according to historical analysis, this exact signal popped at every cycle low since the 2016 correction. The crypto cycle low in 2022 and the two lower lows of 2018 and 2020 were all marked by observations of capitulation on this measure.
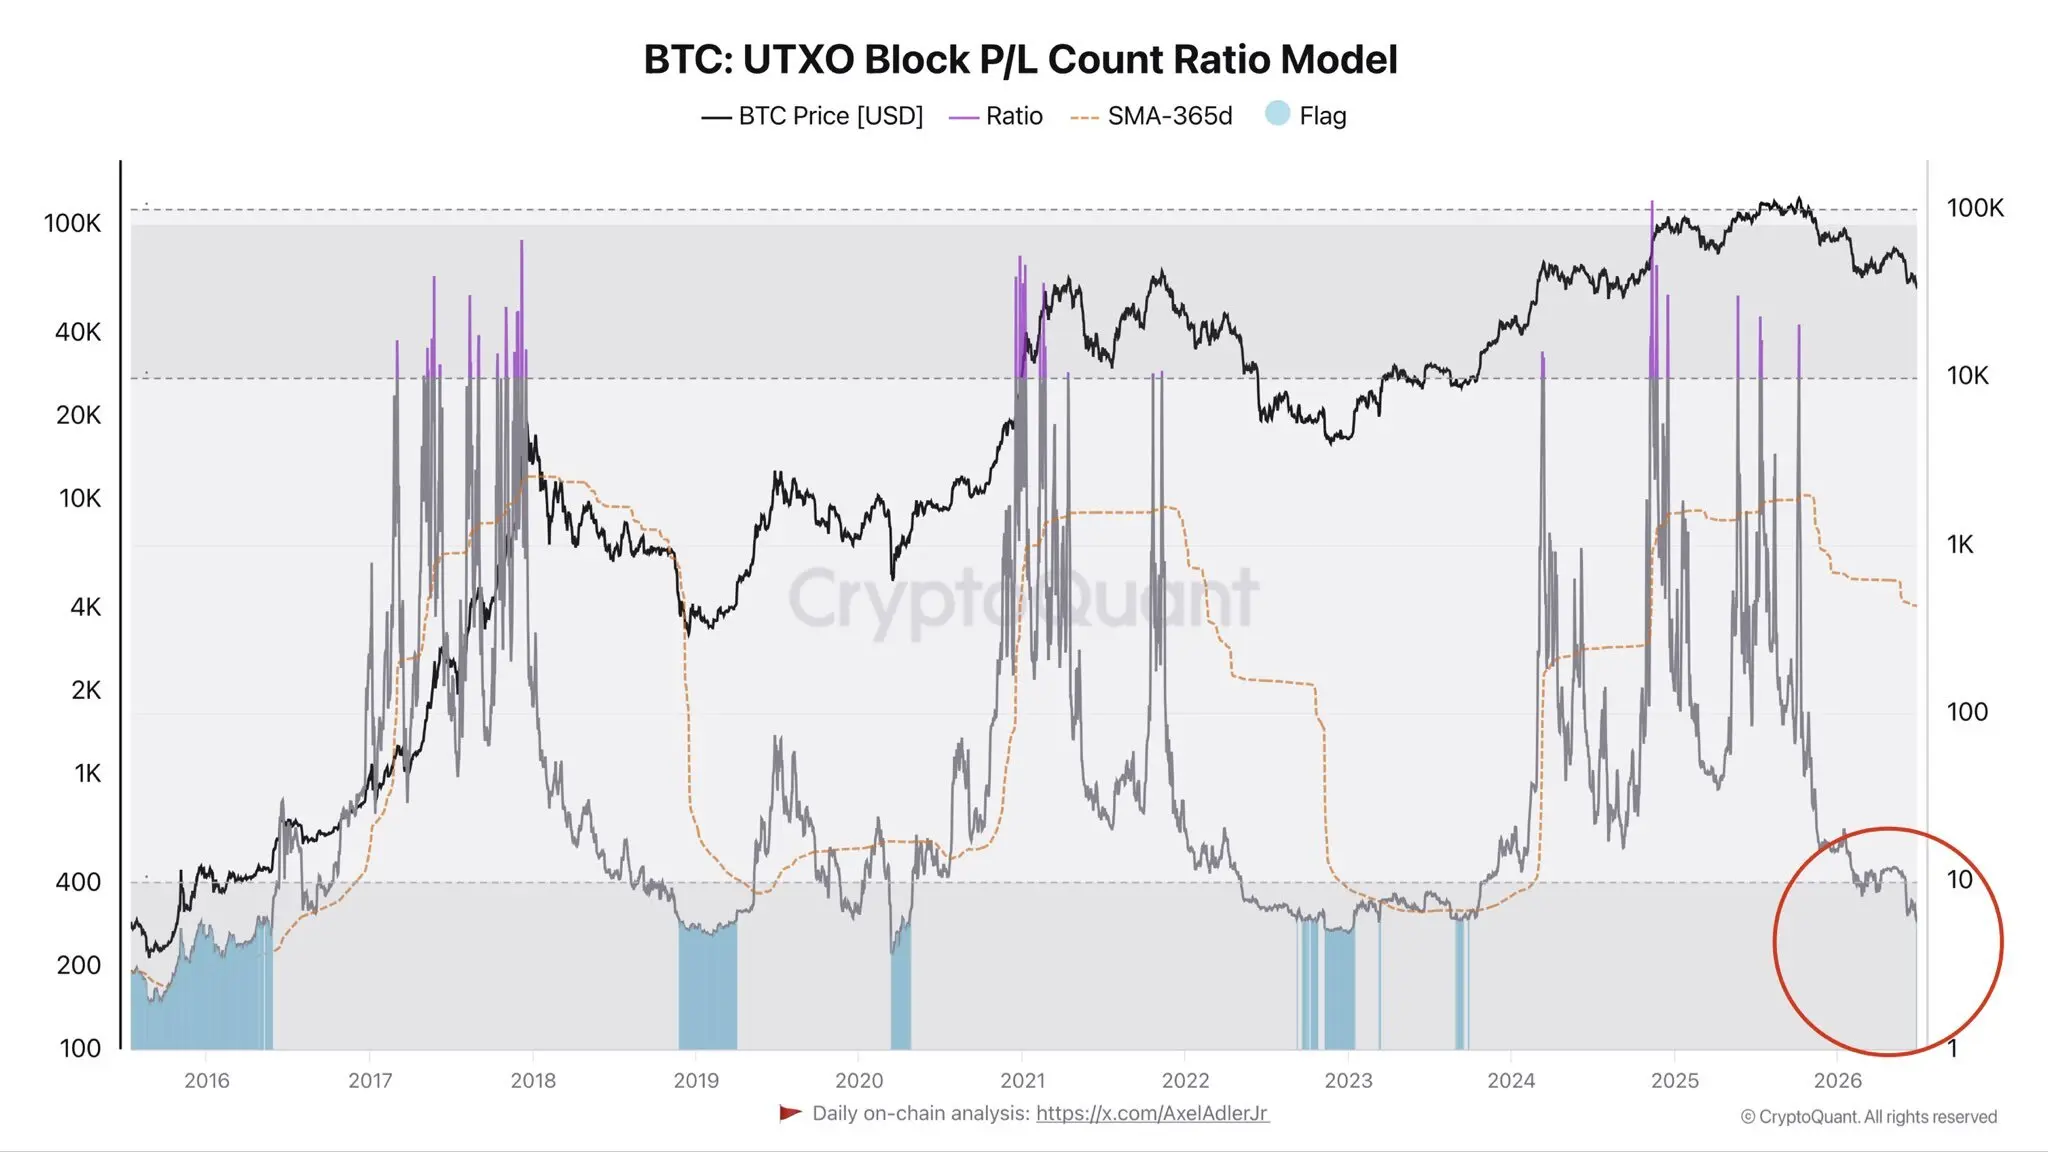
Unlike price predictions or derivatives positioning, this indicator is purely a result of on-chain activity at the time, which provides a certain degree of objectivity. That said, capitulation phases in the past have stretched for weeks or months, so this could well be the start of a longer process instead of a single bright flash.
What are the key price levels confirming a reversal?
For those investors who are seeking to map these competing views onto practical levels to watch out for, here’s how the technical map looks at this stage:
- $58,000 to $60,000 is the zone already tested
- $54,000 marks the 200-week moving average support level
- $50,000 to $54,000 is flagged as the next likely battleground
- Below $50,000 would open the door toward $40,000
- Realized price remains a level BTC hasn’t breached yet
Several analysts have pointed out that, given Bitcoin is currently testing its 200 week moving average, on-chain data shows that the $50,000 to $54,000 band could become the decisive zone, and that BTC hasn’t yet fallen below this level in the current cycle. So, there’s still some room for further downside and then this realized-price floor plus the 200 week moving average has anchored each prior Btc cycle, and hence, most analysts are tracking this level very closely for the months ahead.
How should investors respond to a possible Bitcoin bottom signal?
Given how divided expert opinion remains, chasing a single, definitive marker of a proper Bitcoin bottom signal is arguably less useful than building a strategy that works regardless of who turns out to be right. A staggered approach, placing orders across multiple levels such as $58,000, $54,000, and $50,000, allows investors to average their entry rather than betting everything on one analyst’s call.
For Indian investors specifically, this also means factoring in INR volatility, exchange liquidity, and applicable tax considerations when planning entries. Conservative investors may prefer to wait for confirmation through a sustained move above resistance or a clear reversal in on-chain capitulation metrics, while those with higher risk tolerance might begin scaling in given the structural arguments Mow has put forward.
Final Thoughts
The honest answer is that no single Bitcoin bottom signal has been universally confirmed yet. Samson Mow’s accelerated-cycle thesis offers a genuinely compelling structural argument, but it stands against a wall of skepticism from Thielen, Hayes, Van Straten, and now corroborating on-chain data pointing toward further downside risk.
What’s clear is that the $50,000 to $54,000 zone has emerged as the consensus battleground level across nearly every framework, technical, historical, and on-chain alike. Until Bitcoin either holds firmly above current levels for an extended period or completes a deeper retest toward that zone, the search for a definitive Bitcoin bottom will likely continue well into the second half of 2026.
Is $60,000 already the Bitcoin Bottom?
While a dip to $60,000 attracted aggressive buying support, analysts suggest a true Bitcoin bottom may still be ahead. Historically, bear markets see deeper capitulation flushes (historically down 70–85% from peak), whereas the current cycle is seeing a milder correction. Further consolidation or market shocks might be necessary to form a lasting structural floor.
When exactly will a Bitcoin bottom come?
Historically, Bitcoin bottoms arrive 24–28 months after a halving event. With the recent April 2024 halving, cycle analysts project the highest probability for a macro bottom window to be in Q4 2026 (October–December).
What price will Bitcoin hit the cycle bottom?
Many analysts from firms like QCP Capital and 10x Research have identified an “iron bottom” support zone in the $50,000–$55,000 range. This aligns perfectly with Bitcoin’s 200-week moving average, which traditionally serves as a strong indicator for long-term fair valuation