

Crypto prices are highly sensitive to global liquidity, and a sustained Bitcoin (BTC) bull run is structurally dependent on the Federal Reserve shifting from restrictive policies to mandatory easing. While cooling inflation provides temporary relief and price pumps, a true structural bull market requires a definitive Fed pivot toward monetary easing.
The Fed’s Impact on Crypto Market
Cryptocurrency is considered a risk-on and long-duration asset. Let’s see how Federal Reserve policies have directly impacted Bitcoin historically:
- Interest Rates: When the Fed cuts rates, borrowing costs decrease, freeing up capital that often flows into high-yield, risk-on assets like crypto. Conversely, high or rising interest rates (which reduce liquidity) apply downward pressure.
- The U.S. Dollar (DXY): Hawkish Fed stances (or rate hikes) typically strengthen the dollar. Because Bitcoin is largely priced in USD, a stronger dollar acts as a headwind against major price rallies.
- Quantitative Tightening (QT) vs. Quantitative Easing (QE): An expansion of the money supply broadens global liquidity, which has historically fueled massive digital asset bull runs.
The Fed rate cut has the potential to attract bulls, which may lead to a bull run in the crypto market. A fed rate cut leads to a decrease in the borrowing cost, which frees up the capital. These capital are used in the digital assets, which fuels the price of that particular asset.
What else can fuel bitcoin price?
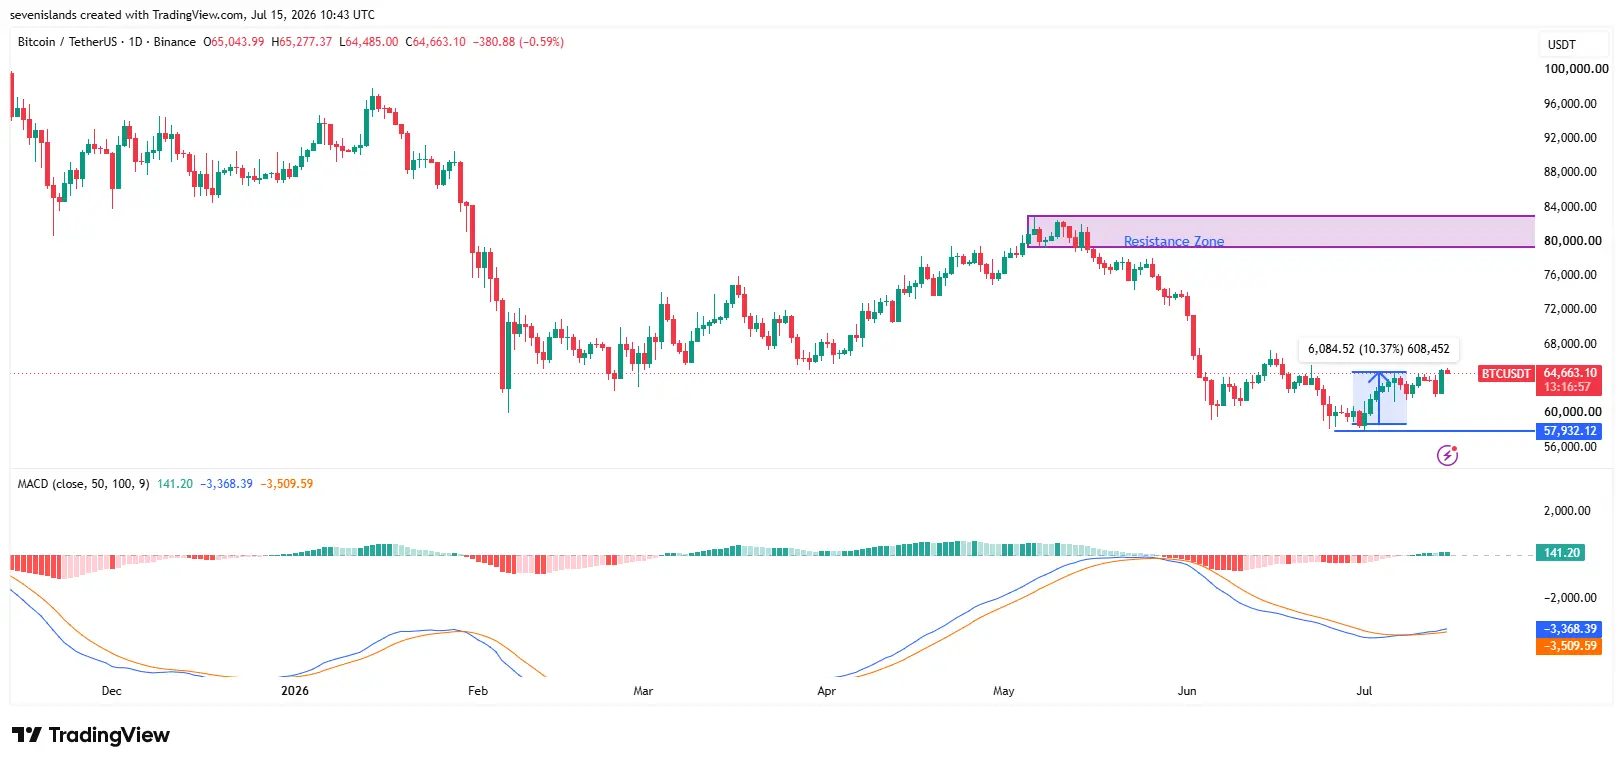
We need to take help from the technical charts to explore forecasts. The daily candle has closed above the previous daily swing high, suggesting that there is a chance of further bullish pressure. Once bulls manage to push the price over the $67292 level and give a close above, it might attract buyers, which could lead to a bull run.
Although on the weekly timeframe there is an unmitigated demand zone, which creates a possibility that the price might fail to sustain this near-term bullish pressure and can come down to test this weekly demand range of 57300-52550. But if the price manages to sustain this bullish pressure, it could lead to a test of an immediate resistance level of 67000, as major indicators like RSI and MACD are favoring a bullish momentum.
Bitcoin fork support falls below 1%; what happens to BTC in August?
The decentralized, open-source software known as a blockchain powers cryptocurrencies like Bitcoin and Ethereum. Every time a community modifies the blockchain’s protocol, or fundamental set of rules, a fork occurs.
Similar to how modifications to internet protocols enable online browsing to improve over time, the majority of digital currencies have distinct development teams in charge of network modifications and enhancements. Therefore, a cryptocurrency may occasionally undergo a fork to improve security or introduce new features.
The Bitcoin Improvement Proposal (BIP)-110 sought to temporarily tighten the network’s consensus rules in a way that would make many types of non-financial transactions far more difficult.
Bitcoin is performing positively as the BIP-110 approaching mandatory signaling window is around August 07. Bitcoin can soar a little bit more if everything goes in favor of BIP-110.
Is BIP-110 protecting BTC or against it?
The BIP-110 debate represents a fundamental philosophical conflict in Bitcoin governance, with valid arguments on both sides regarding whether it protects the network or opens doors for censorship.
Formally known as the “Reduced Data Temporary Softfork,” BIP-110 is a proposed one-year consensus rule tightening designed to significantly restrict non-financial data uploads such as Ordinals, BRC-20 tokens, and large open return payloads from being embedded onto the blockchain.
$1.4B in BTC longs enter the danger zone Is $53K the magnet pulling the price down?
According to a source on X, the $53K zone in Bitcoin is being considered as a danger zone. Because a huge order of $1.4B in BTC has been placed here, which is working as a magnet. This has the potential to drag the price till this zone.
Many retail traders erroneously think that a price visit to $53,500 is guaranteed by this enormous liquidity attraction. They have a basic misconception about the underlying workings of these charts. Simply put, a liquidity magnet is an area with a high concentration of leveraged holdings. Forced liquidations set off a chain reaction of sales that quickens the price change if it approaches this zone.
Only when there is enough selling pressure does the market get to this point. The market doesn’t test that magnet at all if there isn’t significant downward momentum. Instead of using these maps as precise price forecasts, astute traders use them to pinpoint potential volatility hotspots. The balance between real spot demand and speculative leverage, rather than just the location of clustered margin positions, is ultimately what determines price movement.
The bigger liquidity pockets are actually considerably closer to the $55,000 to $57,000 area, according to a number of analysts. A solid underlying backdrop is provided by growing optimism over possible interest rate reductions. Before a deeper cascade starts, dip purchasers have enough funds to withstand selling pressure. Major players may see these drops as excellent opportunities for accumulation rather than as causes to panic and sell their positions, according to institutional accumulation patterns.
MACD flips bullish with $80K in sight
Bitcoin is yet to surpass and close above the 67292 level, which makes this bullish move uncertain. However, in the near term, the price action seems bullish as it has climbed almost 10% in the first 2 weeks of July, according to the technical chart. BTC has been following a pattern after the fall from its all-time high. It has shown recovery on every MACD bullish signal.
Since February, MACD has signaled bullish for the first time. The histograms have crossed the zero line and turned green. Additionally, a bullish crossover has been seen between the EMAs. As we are observing on the price chart, if the price gives a close above the $67,292 level, we will see a formation of a double bottom, which could push the price further up.
Source: BTC/USD Price 1-D Chart
Amid this bullish momentum, bulls might panic in a few zones in the journey of $80K. Based on the technical charts, the price is expected to face resistance near $65,434, $67,292, and $71,147.
Bulls need to push the price by 24% to achieve the milestone of $80K. Few indicators are favoring this forecast. However, this would not be enough to push the price. We need to watch the volume and a few bullish structures to expect the bull run.
Final Thoughts
Bitcoin faces a critical juncture where technical market structures, such as a potential break above $67,292, converge with macroeconomic factors and impending governance debates regarding BIP-110. While short-term bullish signals exist, a sustained move toward $80,000 depends on Federal Reserve policy shifts, requiring traders to exercise caution and monitor institutional accumulation zones.
How do Federal Reserve policies directly impact the price of Bitcoin?
Federal Reserve policies influence Bitcoin because cryptocurrency acts as a high-yield, risk-on asset. When the Fed cuts interest rates, borrowing costs drop, freeing up capital that investors often allocate into digital assets.
What is BIP-110, and why is it causing a governance debate?
BIP-110, known as the “Reduced Data Temporary Softfork,” is a proposed one-year tightening of network consensus rules. It aims to significantly restrict non-financial data uploads, such as Ordinals and BRC-20 tokens.
What key technical levels does Bitcoin need to clear to reach $80,000?
To confirm a sustained bull run toward $80,000, Bitcoin must first surpass and close daily candles above the critical $67,292 level. This move would form a bullish double-bottom pattern.