
The broader weekly trend remains bearish since December 2024, the Algorand price is forming a double bottom near $0.0800, which can embark a buying interest. Open Interest data further supports this shift, with fresh long positions emerging in late August. The key question now is whether this structure can build enough momentum to break past the 100-day EMA and eventually target the $0.200 mark in 2026.
Algorand (ALGO) price overview
At press time, the Algorand price was trading at $0.09049 which remained unchanged in the intraday session. The market capitalization is $817.746M and the 24-hour trading volume is $33.64M. The chart structure suggests that the overall trend is bearish but buyers seem to be interested and can push the price further.
Algorand price seems to be forming double bottom pattern: Can it reach the $0.200 mark in 2026?
Algorand price chart has displayed a strong bearish trend on a weekly timeframe. The price has kept declining since December 2024. However, this bearish trend seems to halt near the $0.0800 level. The price is forming a double bottom pattern in this zone on a weekly timeframe and has climbed by 13%.
If the price remains over the $0.0800 zone, buyers might be confident. If this chart’s structure manages to attract institutions, the price could extend to the 100-days EMA on a weekly timeframe. Once the Algorand price holds over the 100-days EMA, strong buying pressure can be anticipated. After a successful breakout from the 100-days EMA, the price could easily hit the $0.200 mark.
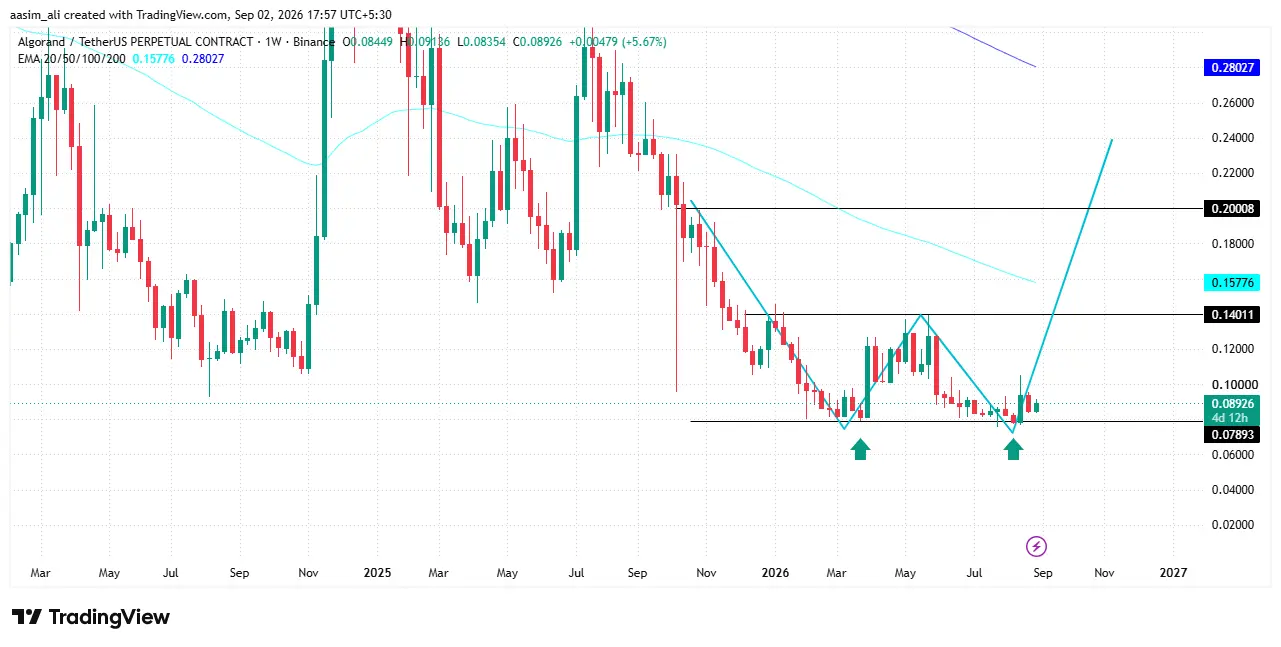
Conversely, if buyers lose the momentum and the price slips below the $0.0800 then sellers may dominate. If the price sustains below this level, it would be difficult for buyers to bounce back and the bearish trend may continue.
Algorand coin Open Interest (OI) analysis
Key data points:
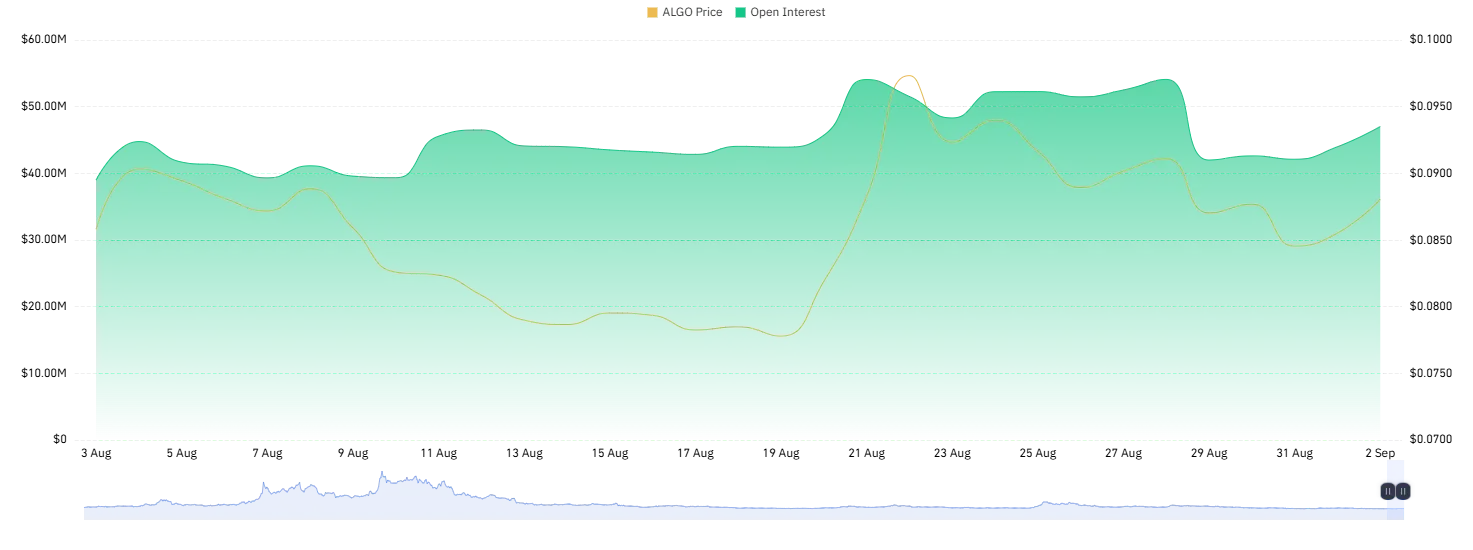
- Aug 3–7: OI rose from $33M to $44M.
- Aug 9–19: Price declined steadily from $0.08736 to a low of $0.07653 (around Aug 19), while OI stayed elevated and stable ($40M–$46M).
- Aug 20–22: Sharp price rally to $0.10494 (peak), OI surged to its high of $55M.
- Aug 23–25: Price pulled back to $0.08894, OI dipped to $45M before climbing back to $52M.
- Aug 27–29: Price held near $0.08890, OI stayed elevated ($52M–$54M).
- Aug 29–31: Sharp OI drop to $41M alongside price falling to $0.083.
- Sep 1–2: Both OI ($46M) and price ($0.088) recovering.
Impact on price analysis:
Rising OI alongside falling price (Aug 9–19) suggests short positions building up, adding downside pressure. The Aug 20–22 surge, where OI and price rose together, points to fresh long positions driving the rally. The later OI decline with falling price (Aug 29–31) indicates position unwinding/long liquidations rather than fresh shorts. The current uptick in both metrics could signal renewed bullish positioning, though confirmation from volume would strengthen that read.
ALGO price and volume analysis
ALGO has moved in a broad range between $0.07559 and $0.098 over the past month, with price and volume showing a clear correlation. The month started with ALGO trading near $0.088 before drifting down to a low of around $0.077 by mid-August (14–19 Aug), a period marked by relatively subdued volume in the $20M–$30M range.
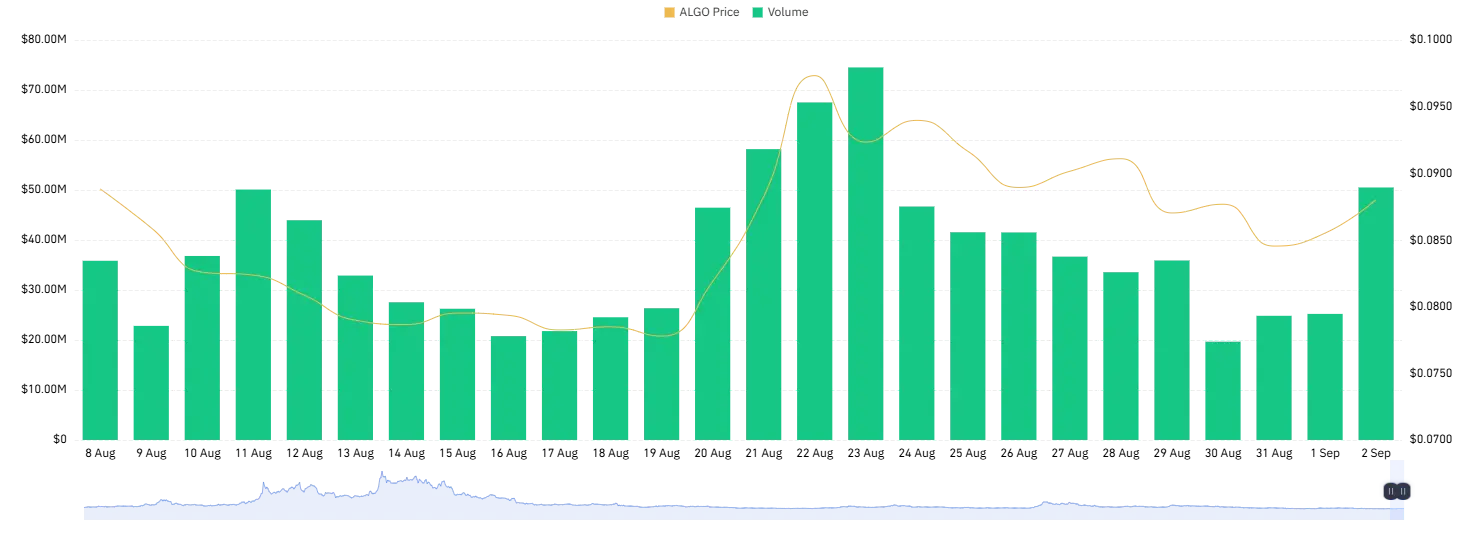
The real momentum shift came around 20–23 August, when volume surged sharply, peaking near $74M on 23 August and price rallied in tandem to its monthly high of roughly $0.10494 on 22 August. This spike suggests a strong buying wave, likely driven by a news catalyst or broader market strength.
Post-peak, ALGO was somewhat consolidating with a moderate volume ($30M–$47M), before volume picked up again toward 1–2 September, hinting at renewed accumulation as price edged back up toward $0.090.
Final Thought
Algorand’s price action over the past month paints a market at an inflection point rather than a confirmed reversal. The double bottom near $0.0800, paired with the late-August surge in Open Interest and volume, shows that buyers are willing to step in and defend this zone but the subsequent OI unwind (Aug 29–31) is a reminder that this demand is still fragile and prone to liquidation-driven swings.
For the $0.200 target to come into play, ALGO needs a sequence of confirmations, not a single spike: first, a decisive weekly close above the 100-day EMA on strong volume; second, OI building up alongside price (not against it), signalling fresh conviction rather than short covering; and third, the broader crypto market avoiding a risk-off move that could drag altcoins down regardless of their own structure. Until that EMA flips into support, rallies from the $0.0800 zone are more likely to be counter-trend bounces within a still-bearish weekly structure than the start of a sustained recovery.
Can Algorand price reach $0.200 in 2026?
It’s possible but remains speculative. ALGO would first need to break past the 100-day EMA on the weekly timeframe and hold above it before a move toward $0.200 becomes realistic.
What is the double bottom pattern forming in ALGO’s chart?
ALGO’s weekly chart shows a double bottom near the $0.0800 level, where the price has bounced twice, climbing about 13% from that zone, a pattern often seen as an early sign of trend reversal.
What does the Open Interest (OI) data suggest about ALGO’s next move?
OI data shows fresh long positions emerging in late August, with both OI and price recovering into early September ($46M OI, $0.088 price), hinting at renewed bullish positioning, though volume confirmation is needed to strengthen this outlook.