

The stacks price chart has displayed a sharp recovery after a strong bearish trend. This bullish trend has smashed the key moving averages, which showcases the bulls’ domination. During this bullish trend, trading volume and Open Interest (OI) have also witnessed great changes. Furthermore, the price has reached a major resistance zone. Let’s see how Stacks’ price can behave in this territory and what could be the possible outcome.
Stacks (STX) price overview
At press time, STX coin was trading at $0.2595 with an intraday loss of -4.5%. It has a market capitalization of $483.201M, and the 24-hour trading volume is $44.906M. It has a circulating and total supply of 1.862B.
Stacks price reaches the major resistance zone; is it a breakout ahead?
Stacks’ price has experienced a strong bearish trend on a wider timeframe. However, strong buying pressure was received, which resulted in a V-shaped recovery. Amid this bullish trend, the price has exceeded the key moving averages. The price surged by 91.72% last week. Furthermore, it has continued the bullish trend this week and has surged by more than 10%.
Amid this bullish trend, the price has reached a major resistance zone of $0.285. However, the price has faced resistance near this zone and has dropped by around 10%. If buyers bounce back again, then this fall could convert into a pullback.
If the Stacks price triggers a pullback, then the price could experience a breakout from the major resistance level of $0.285. Once the price manages to hold the price over this level, a strong bullish trend can be anticipated. If things go in favor of buyers, then the Stacks price may reach the next resistance level of $0.400, which is also a psychological level.
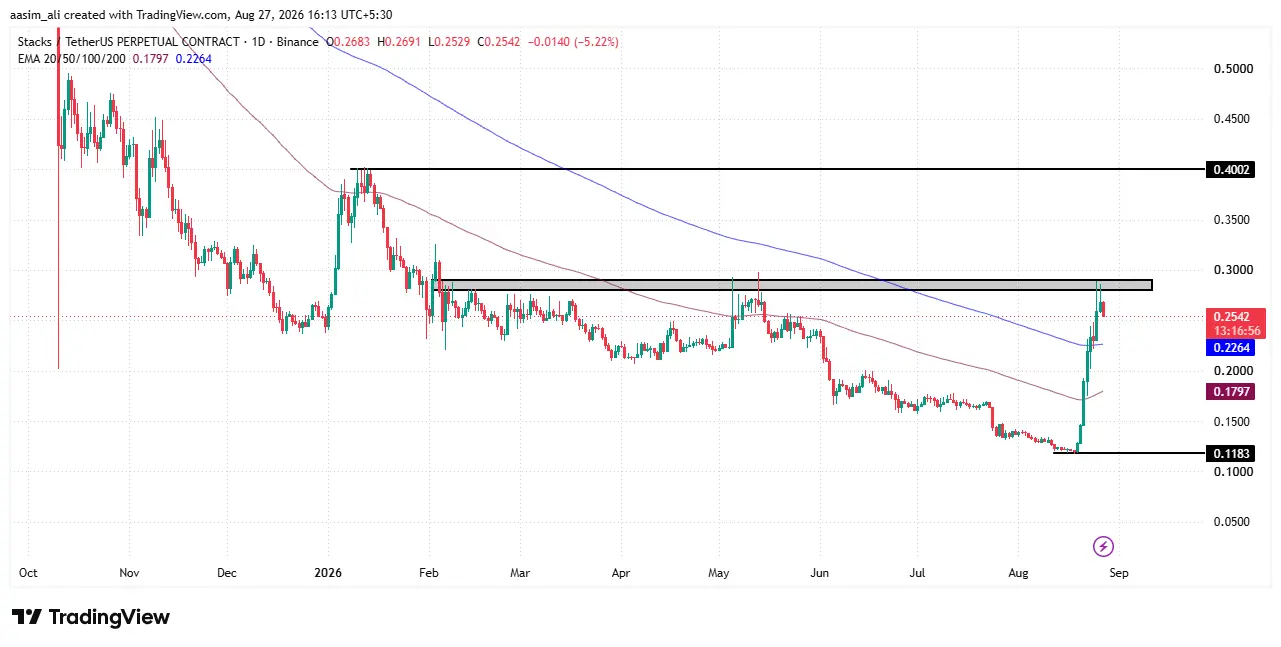
Conversely, if the Stacks price fails to dominate this major resistance zone, then sellers might be confident. If the price forms any bearish candlestick pattern, most of the traders and investors might prefer to book profit. Here, profit booking can lead to a selling pressure and the price may decline further.
Stacks Price vs Open Interest, (30 Jun – 26 Aug 2026)
- STX traded in a range of roughly $0.12–$0.27 over the period.
- Late June–24 Jul: STX held steady near $0.22–$0.24, with open interest flat around $12–15M.
- 24 Jul–20 Aug: Price fell steadily from $0.24 to a low near $0.115–$0.12 (a multi-week downtrend), while open interest actually rose to $18–22M, divergence often read as short-side leverage building.
- 20 Aug onward: Sharp reversal price rallied from $0.12 to $0.27, a 120%+ move in a week
- Open interest surged in tandem, jumping from $18M to a peak of $60–65M by 26 Aug, showing fresh leveraged positioning entering with the rally
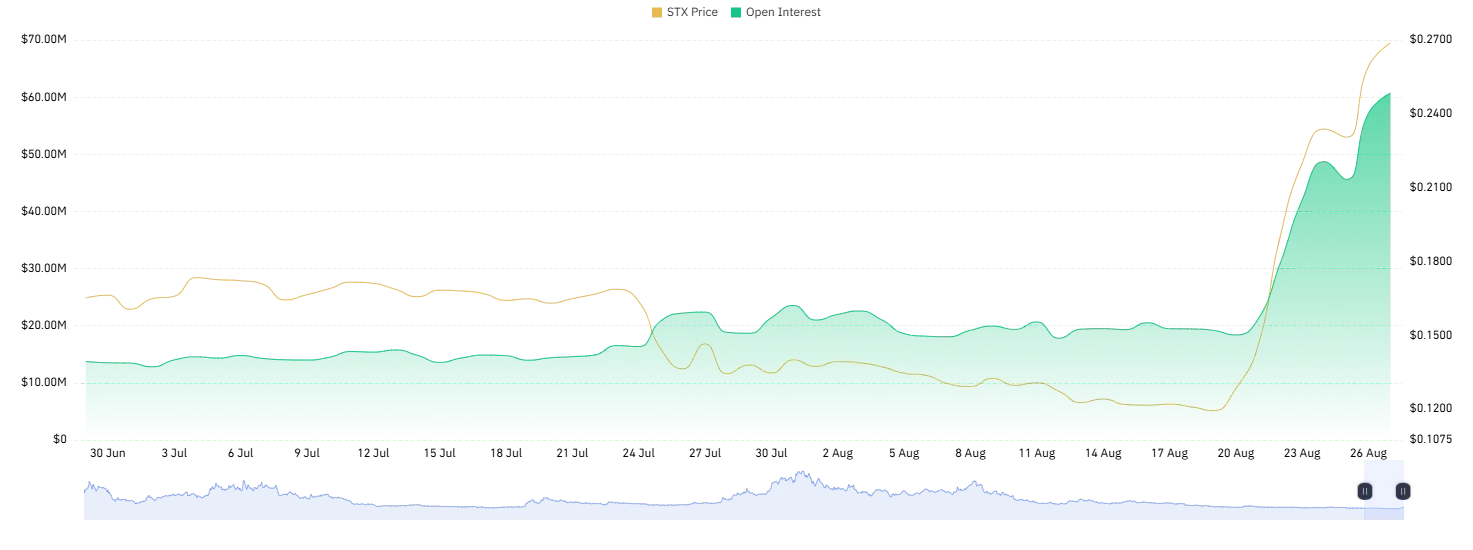
This lines up with STX open interest climbing from roughly $17 million to approximately $57.15 million by August 26, confirming traders rebuilding leveraged positions alongside the price advance.
Stacks coin price and volume analysis for August
Stacks staged a remarkable turnaround in August, breaking free from the tight $0.11–$0.13 range it had been trading in for nearly three weeks. The real story, however, lies in the volume data. Daily trading volume, which hovered modestly between $20M and $50M through mid-August, exploded past $200M by the final week, peaking near $295M on 26 August. This surge wasn’t a quiet, low-liquidity move, it was accompanied by a price rally that saw STX climb over 120% in just over a week, touching $0.27.
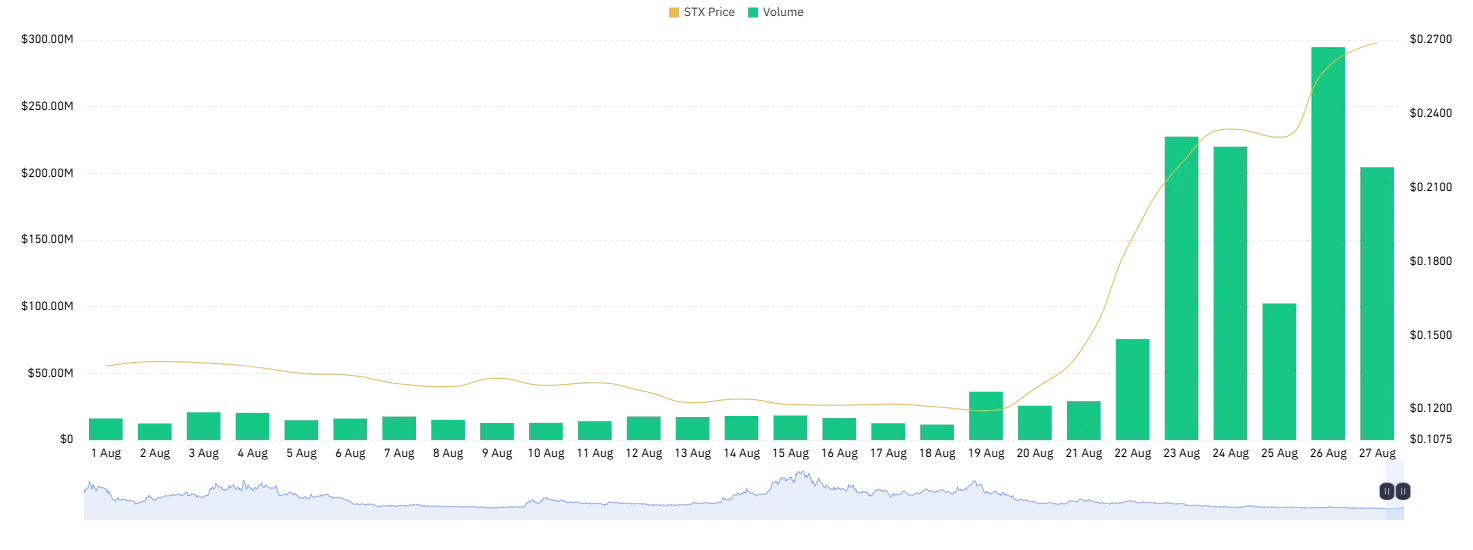
Such a strong correlation between rising volume and rising price is typically viewed as a bullish confirmation signal, suggesting genuine market conviction rather than speculative noise. That said, the slight cooldown in volume on 27 August, even as price held firm, hints that STX may be entering a consolidation phase before its next decisive move.
Final Thoughts
Stacks price has clearly shown strength in reversing a prolonged downtrend, and the surge in both volume and open interest confirms that the move is backed by real capital rather than thin, speculative trading. That said, the $0.285 zone remains the key battleground. A decisive close above this level, ideally accompanied by sustained volume, would open the door toward the $0.400 psychological mark. However, the sharp rise in open interest alongside the price rally also means leverage has built up quickly on both sides, which raises the risk of volatility or a long squeeze if momentum stalls.
The recent pullback and slight cooldown in volume suggest the market may be pausing to consolidate rather than reversing outright. Traders should watch whether STX can hold above prior support (around $0.22–$0.24) on any retracement, as losing this zone could reignite selling pressure. For now, STX sits at a pivotal juncture: a clean breakout confirms bullish continuation, while rejection here could see the coin retest lower support levels before its next major move.
What is the key resistance level for STX right now?
The major resistance zone sits at $0.285. A decisive breakout and hold above this level could open the path toward the next psychological resistance at $0.400.
What happens if STX fails to break above $0.285?
If STX cannot sustain a move above $0.285 and forms bearish candlestick patterns, traders may book profits, triggering selling pressure that could push the price down toward support levels near $0.22–$0.24.
Is the rise in Open Interest a bullish or bearish signal for STX?
Rising open interest alongside a price increase is generally viewed as bullish, since it reflects fresh capital and leveraged positions entering the market. However, it also increases the risk of sharp volatility or liquidation cascades if the price reverses suddenly.