

The Siren price has definitely shown one of the most violent movements in the 2026 crypto market. The BNB Chain-based AI meme project has managed to attract attention by trading close to $3.83, in March 2026 before losing almost all of it over the past 90 days. As of July 7, 2026, the Siren price sits deep in distressed territory, trading around $0.04201, a level that puts the token roughly 98% below its all-time high.
If you bought the token during the euphoric March rally, the current numbers are surely disheartening. But more importantly, you have to properly understand what is causing this decline and whether it makes sense to wildly speculate on a comeback before this year is over.
So here’s a deep dive into where the Siren price is today, why it’s dropping, and what traders should expect next.
What is happening with the Siren price right now?
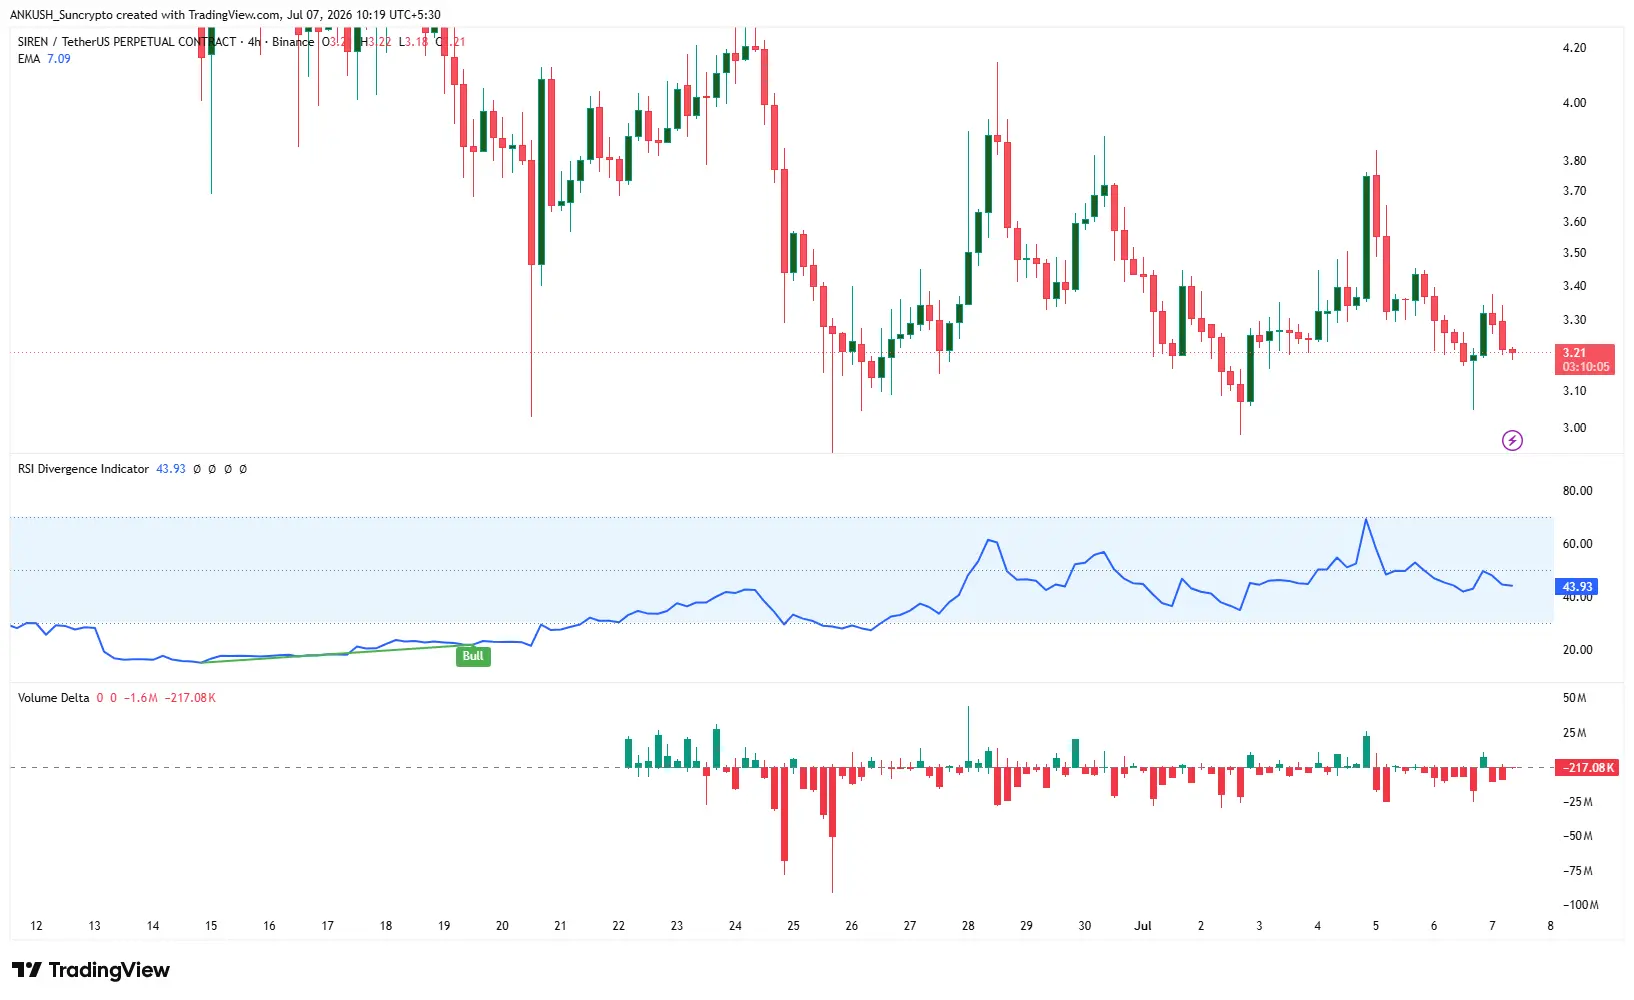
The Siren price has failed to hold even its most modest support zones over the past month. After a brief bounce in mid-June that carried the token back toward $0.11, sellers returned almost immediately, and by early July it had broken below the $0.032–$0.105 range it had spent days consolidating inside.
At the time of writing, the token is trading close to $0.04201, down roughly 7% over the last 24 hours and a massive 33.83% in the past 7 days! Token’s market cap is hovering near $30.48M, with a circulating supply of approximately 724.21 million tokens. Converted for Indian traders tracking the Siren price in INR, that works out to roughly ₹3.9 per token, a fraction of the ₹300-plus it briefly touched in March.
But what’s more worrying is that this is not happening in isolation, nor is it a fresh catalyst, regulatory shock or macro event that has caused it to happen. Trading volume has remained quite high relative to the shrinking size, with $7-8 million trading in a single day, which indicates active repositioning rather than simply a token starting to float on thin liquidity.
What are the key drivers behind the Siren price crash?
There are a number of overlapping forces that have all contributed to the Siren price dropping this far, and honestly, none of them look like they’re resolving quickly:
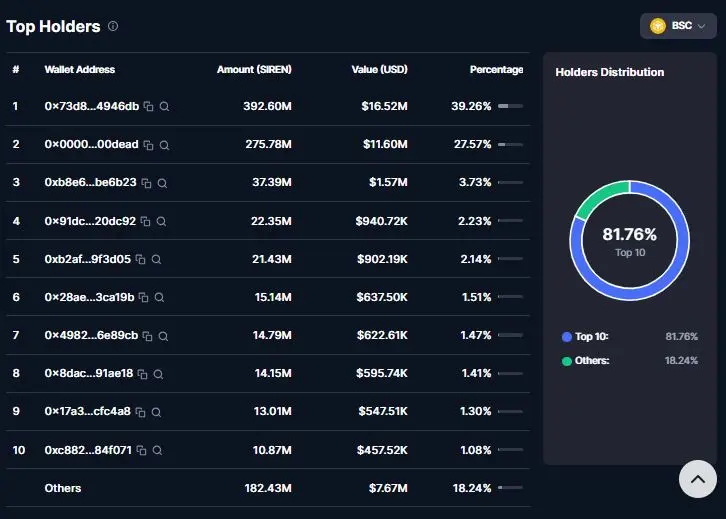
- Extreme supply concentration, with over 80% of tokens held across just ten wallets currently.
- A single dominant wallet reportedly controlling close to half of that concentrated supply base.
- A documented history of at least four separate pump-and-dump cycles occurring since February.
- The June whale dump of 670 million tokens, roughly 92% of circulating supply, for $64.8 million.
- Core products like SirenAIAgent and SIREN Dex are still listed as “coming soon” with no live launch.
- Renewed on-chain scrutiny from investigators questioning the token’s valuation and insider control.
- Elevated trading volume during declines, suggesting forced selling rather than organic drift.
- A broader AI-meme token category that remains highly sentiment-driven and prone to sharp reversals.
How did one whale wallet shake the Siren price so badly?
The worst single driver behind the Siren price crash continues to be the whale that was identified by on-chain analytics companies including Lookonchain, EmberCN, and Spot On Chain to have sold off around 670 million Siren tokens in a 48 hour period, which represented almost 92% of circulating supply, for an estimated $64.8 million. About $25.7 million of that was deposited onto centralised exchanges like Bitget, Binance, Gate and KuCoin, while close to $39 million remains in on-chain wallets, subsequently divided amongst hundreds of addresses to make the path of that money hard to capture.
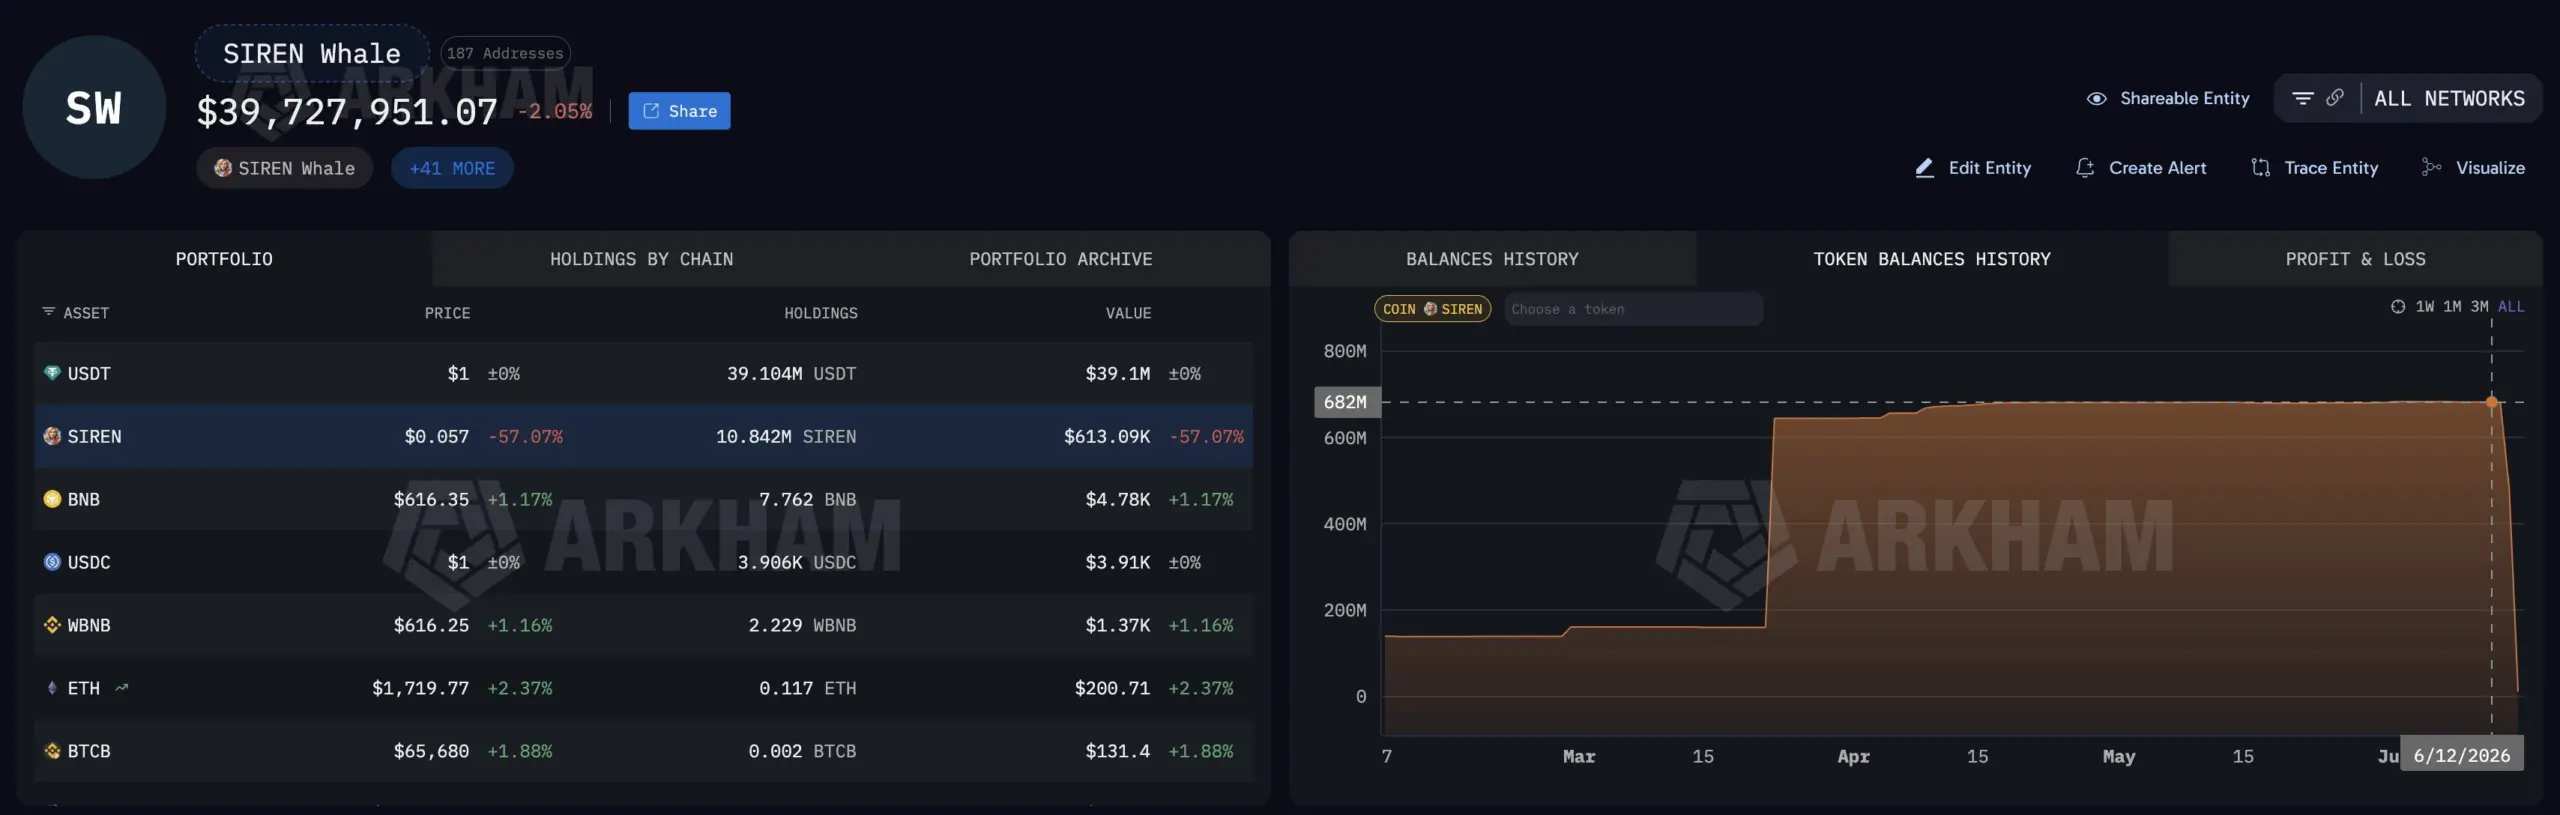
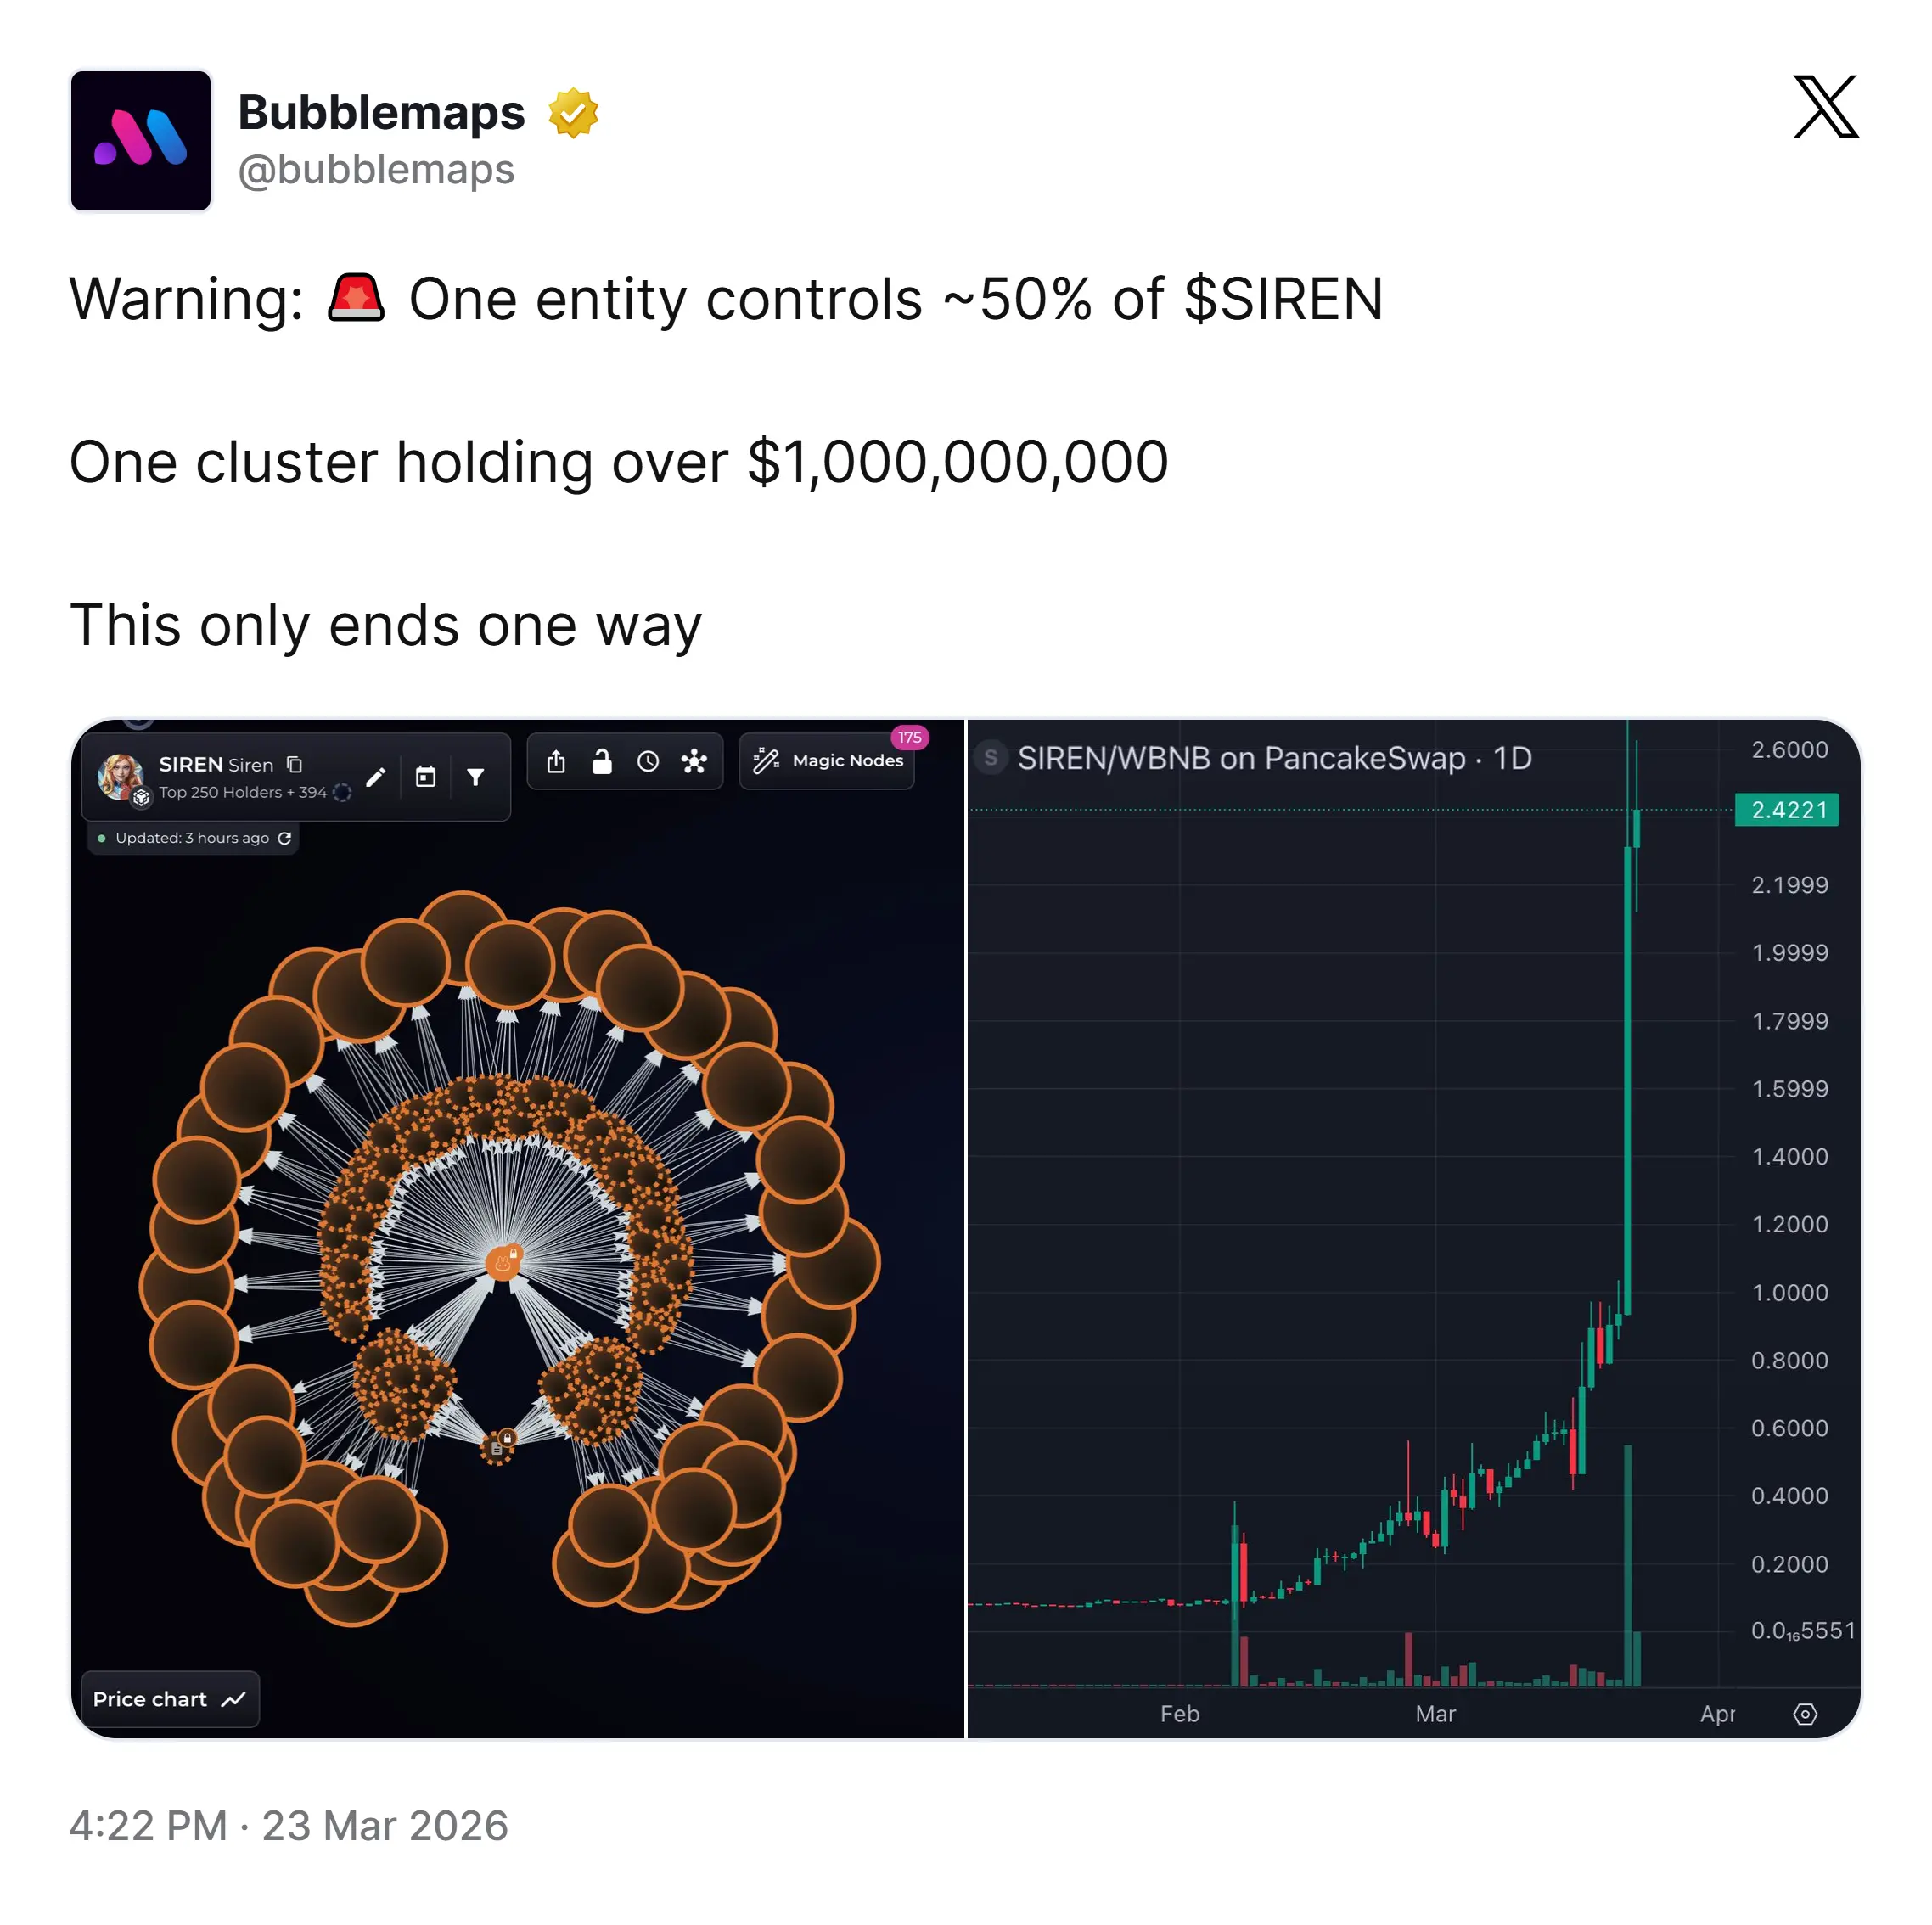
That single dump sent the token from around $1.30 to only $0.05 in a few days, a drop that many experts referred to as a “textbook pump-and-dump.” Blockchain investigator ZachXBT and analytics platform Bubblemaps had already flagged months earlier that a tight wallet cluster controlled close to half of SIREN’s supply, with some addresses reportedly linked to DWF Labs. The remaining balance, still estimated to be worth nearly $39 million at last check, means the risk of another leg down has never fully gone away.
Why has the Siren price failed to recover from its June bounce?
Siren did perform a bounce in June, gathering a near 150% rally and briefly moving into $0.11 territory well above key support for nearly five trading sessions, longer than any previous cycle. That was a clear signal that a bottom was developing. However, a breakdown of the $0.105 control area had already occurred by the first week of July, pushing the token back into the $0.032–$0.060 range seen at the lows of the original crash.
On-chain researchers now count this at least as the fourth pump-and-dump cycle since February, following a near-identical script each time: accumulation, a sharp pump that liquidates leveraged shorts, and then distribution into retail buyers chasing the move. Until independent research proves that the controlling wallet cluster significantly shed its holdings; each bounce in Siren price is carrying the risk that it is actually another distribution rather than a serious reversal.
Are investigators still raising red flags over Siren price?
Yes, pretty recently. On July 6, 2026, blockchain investigator ZachXBT publicly referenced Memecore and other meme tokens while questioning inflated valuations built up on heavily insider controlled supply, emphasizing that a handful of wallets seem to control over 90% of the tokens in circulation. ZachXBT had separately raised similar insider-control concerns about Siren earlier in the year and reiterated the pattern in commentary around other tokens in early July. This kind of trampling doesn’t add new mechanical risk, but it does suppress institutional and retail confidence at a time that the project could use some legitimacy.
On the other hand, Arkham Intelligence had also previously called out SIREN’s trading pattern, specifically that the 24hr volume was greater than $224M against a token value well below that amount during the crash, at a turnover ratio that would only be indicated by a full liquidity event versus normal market transaction volume. All of these are independent actions but if considered together, they point to the same conclusion: the token’s value is largely being pumped/deflated at the discretion of a small clique of wallets rather than wholesale demand.
What are the key technical levels to watch for in the siren price?
For traders who prefer the chart rather than the headline, these are the levels of immediate relevance:
- Immediate support sits near $0.032, just above the deeper $0.00004056 all-time low.
- First resistance layer stands around $0.065, capping any short-term relief rally.
- Stronger resistance zone lies between $0.095 and $0.105, the recent breakdown level.
- A confirmed close above $0.112–$0.115 would open a path toward $0.125.
- Price remains below all major moving averages, confirming bears hold control.
- Elevated volume on declines signals active selling, not simple illiquid drift.
Can Siren price recover in 2026?
A comeback close to the $3.83 all-time high appears very improbable in 2026 and using that as a benchmark would be downright deceptive. A more realistic question to tackle is whether Siren price can stabilize and rise gradually. In the base-case scenario, the Siren price probably remains pinned between $0.045 and $0.09 for the remainder of the year unless a new whale exit shocks the price. The upside would depend on Siren regaining control of the $0.095–$0.105 zone for several days each, which could pave the way for a year-end surge to $0.14–$0.20 only if wallet concentration visibly reduces and the promised product launch actually happens.
The bearish case, unfortunately, remains just as plausible. If the dominant wallet cluster begins moving funds toward exchanges again, a retest of the $0.00004056 all-time low is entirely possible, and the Siren price could spend the rest of 2026 searching for a floor rather than building a base. Sentiment and the broader market conditions aren’t the deciding factors here; It’s about whether SirenAIAgent and SIREN Dex actually ship and whether on-chain data confirms real distribution away from the handful of wallets currently in control.
Final Thoughts
The Siren price story in 2026 has been less about product fundamentals and far more about extreme supply concentration meeting thin liquidity repeatedly. Each rally has been followed by distribution, and the token is still down about 98% from its March peak, with no sign of the whales still in control giving up much.
Traders and investors are advised to monitor the chart closely and be aware of each bounce until the on-chain data confirms the concentration is easing and the products actually come live instead of just ‘coming soon.’ Until then, the safest assumption is that the same wallets driving the last four cycles retain the power to shape the next one too.
Why is the Siren price so volatile?
The primary driver of Siren’s erratic price movement is extreme whale control. With a single address or a very small group of holders controlling the vast majority of the token supply, the market is highly susceptible to sudden, massive sell-offs (distribution events) or viral pump-and-dump cycles.
What exactly caused the Siren price crash?
Blockchain analytics platforms like Lookonchain and Spot On Chain confirmed that the crash was entirely triggered by a single, coordinated whale entity. This entity controlled an alarming 92% to 94% of the active circulating supply. Over a 48-hour period, the whale dumped approximately 670 million SIREN tokens, successfully extracting $64.8 million USDT in profit.
Can Siren recover in 2026?
A genuine, organic price recovery for Siren (SIREN) in 2026 is highly unlikely due to structural market manipulation and a complete lack of fundamental utility. However, high-magnitude, short-lived speculative spikes are almost certain as the controlling whale group prepares for another pump-and-dump cycle