
Raydium price has been in a strong bullish trend and has surged by more than 200% since September. Raydium price was trading over the key moving averages on a daily timeframe which showcases the bulls’ domination. Its trading volume has increased sharply in the last few days. Raydium (RAY) is also known as RAYSOL.
Raydium Fundamentals
Raydium is a decentralised exchange (DEX) and automated market maker (AMM) built on the Solana blockchain. It lets users swap tokens, provide liquidity and earn trading fees. It also offers concentrated liquidity pools and LaunchLab, a platform for launching new tokens. Thanks to Solana’s fast, low-cost transactions, Raydium has become a key liquidity hub for tokens in the ecosystem.
RAY is the platform’s native token, with a maximum supply of 555 million. It is used for governance and staking, and a share of protocol trading fees is used to buy back RAY from the market. This links demand for the token to trading activity on the platform, so higher volumes can support the price.
However, competition from other Solana DEXs and token launchpads is a risk. RAY’s price also stays sensitive to meme-coin activity and overall market sentiment.
Raydium price overview
At press time, Raydium was trading at $2.47 which remained unchanged in an intraday session. Its market capitalization was $666.459M and the 24-hour trading volume was $114.096M. Its circulating supply is 269.864M while the total and maximum supply is 555M.
RAY price technical analysis over 1-D timeframe
Raydium price has experienced a bullish rally for the past few days. RAY price has triggered a pullback on a daily timeframe in early October and has surged by more than 30%.
If buyers remain strong, RAY coin price can continue the rally further and the price can reach the immediate resistance level of $3. Here, OI and trading volume can play a crucial role. If OI and volume increases with price, buyers might be confident and the RAY price can extend to the $4 mark in the next few weeks.
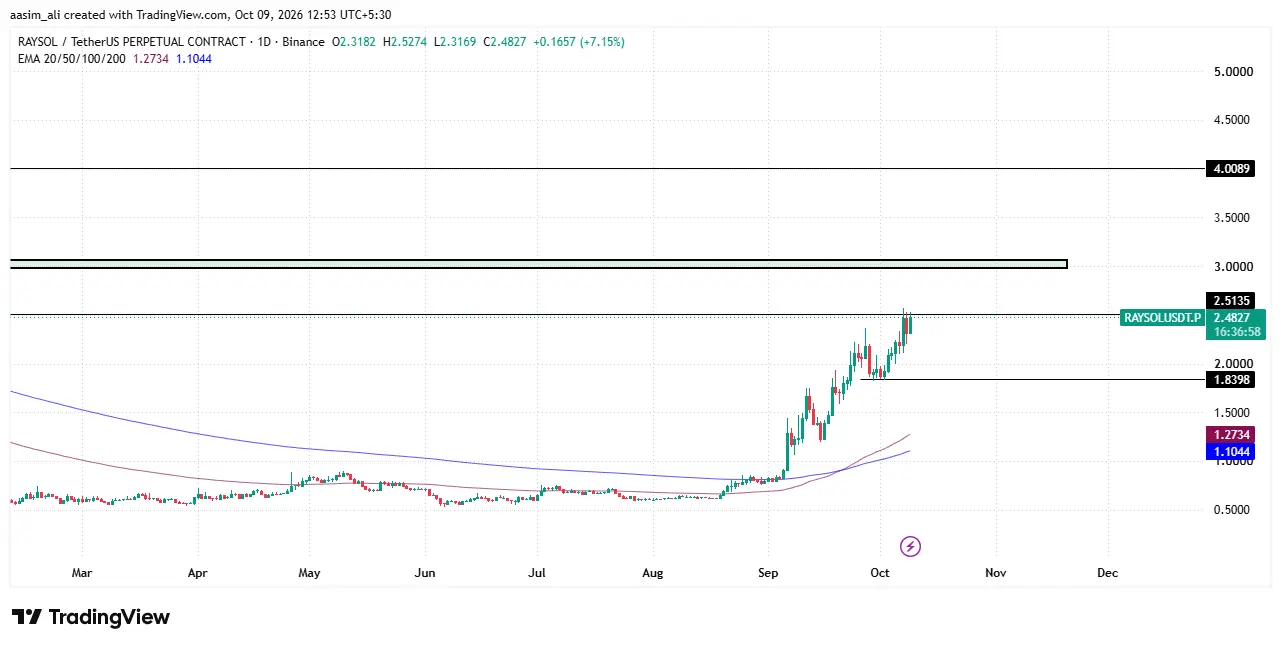
Conversely, if the Raydium price faces resistance level of $2.50 then profit booking can be observed. Here, profit booking can result in a bearish move. If the profit booking increases then the price could drop to the immediate support level of $1.85.
Raydium price outlook
Raydium has staged a strong rally over the past five weeks. RAY climbed from roughly $0.72 in early September to a peak near $2.52 on October 8, a gain of over 200%. The advance was driven by two major volume spikes: one around September 7, when trading volume crossed $270 million, and another near September 12, when it touched about $350 million.
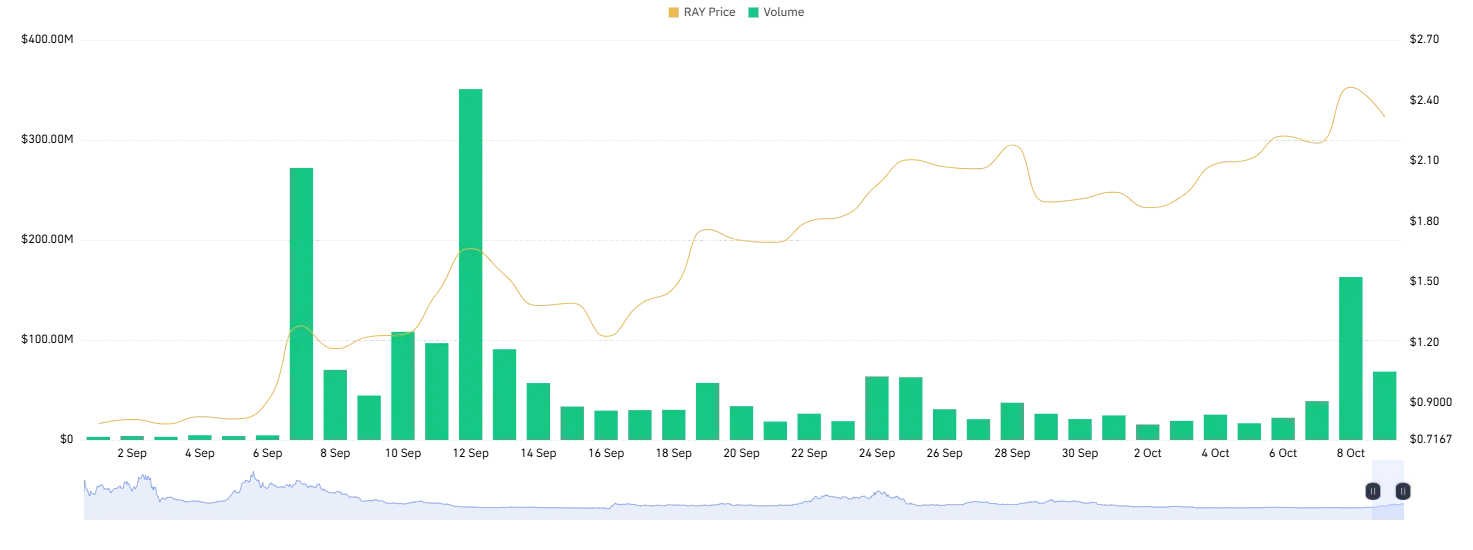
Since then, the trend has been a series of higher lows, with the price holding above $1.80 despite quieter trading sessions. A fresh volume surge of over $160 million on October 8 pushed RAY to its new high, but the price has since slipped toward $2.30 on declining volume.
If buyers defend the $1.90 to $2.10 zone, RAY could attempt another move toward $2.45 and beyond. A breakdown below $1.80, however, may trigger a deeper correction. Traders should watch volume closely for confirmation.
RAY Price Prediction: Short Squeeze Fuels Rally, but Can Bulls Hold $2.40?
Raydium was trading near $2.48 after climbing from roughly $1.85 in late September to a high near $2.57. Derivatives data suggests the move was driven by more than spot demand.
On October 7, aggregated open interest jumped from about 10 million to nearly 15 million coins, while the open interest-weighted funding rate plunged to around -0.17%. That combination points to crowded short positions being squeezed as price broke higher.
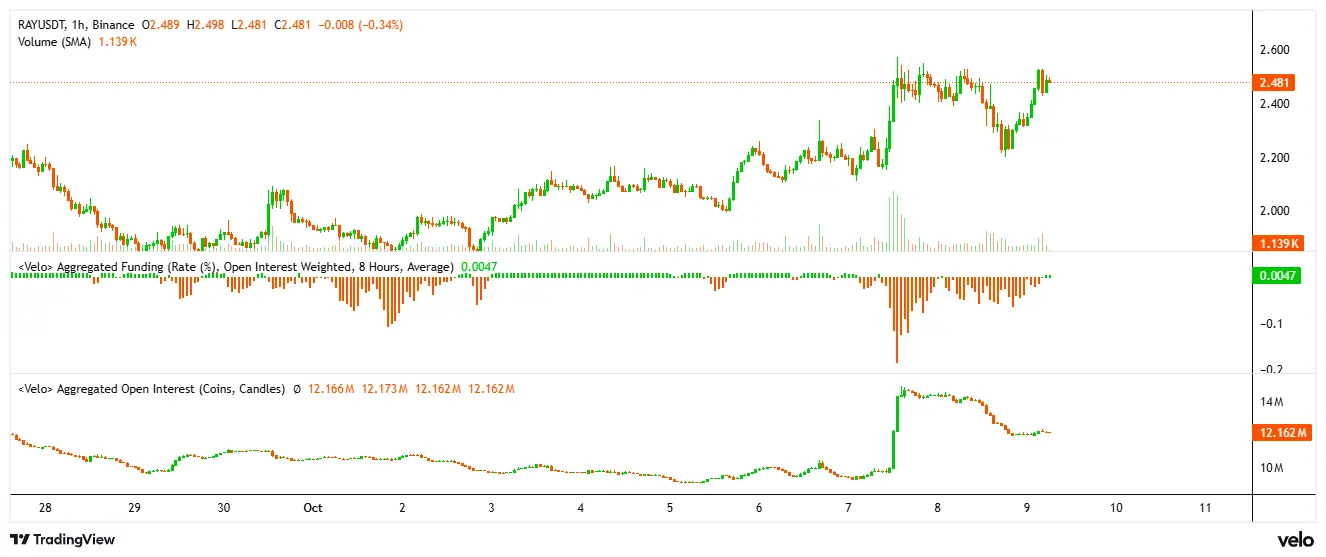
Since then, open interest has cooled to about 12.2 million coins, suggesting excess leverage has been flushed out. Funding has returned to slightly positive at 0.0047%, a sign of a more balanced market.
Technically, Raydium price faces resistance at $2.55-$2.60. A clean breakout could open the path toward $2.80. Support sits at $2.40, with $2.20 as the key level below. Rising volume and open interest would strengthen the bullish case.
Final Thoughts
Raydium’s rally from about $0.72 in early September to a high near $2.57 is hard to ignore. The price is holding above key moving averages, and the pattern of higher lows shows buyers are still defending dips. Derivatives data adds context: the October 7 jump in open interest alongside deeply negative funding points to a short squeeze, not just organic spot demand. Since then, open interest has cooled and funding has normalized, so the market looks healthier and less overleveraged.
The next test is the $2.55-$2.60 resistance zone. A clean breakout backed by rising volume and open interest could open the way to $2.80, then $3, and a $4 target would need that momentum to hold for several weeks. If Ra fails at resistance, profit booking could pull the price back to $2.40 or $2.20, and a break below $1.80-$1.85 would put the broader uptrend at risk.
Can Raydium price reach $4?
It is possible but not certain. RAY would first need to break the $2.55-$2.60 resistance zone and then the $3 level. A move to $4 would also need rising volume and open interest to hold for several weeks. Without that, the price could stall or pull back.
Why is the Raydium price going up?
RAY has surged more than 200% since early September, driven by sharp volume spikes and strong buying above key moving averages. Derivatives data also shows a short squeeze on October 7, when open interest jumped and funding turned deeply negative.
What are the key support and resistance levels for RAY?
Immediate resistance is around $2.55-$2.60, followed by $2.80 and $3. On the downside, support sits near $2.40 and $2.20, with a deeper level around $1.80-$1.85. A break below that range could put the broader uptrend at risk.