

ENA price has displayed extremely bullish momentum and has smashed the key moving averages in just 3 days. The price has reached a major resistance zone. Amid this bullish trend, the trading volume has experienced a great pump which showcases the engagement of traders and investors.
The chart structure suggests that the bearish trend has flipped to bullish. However, the price still has some barriers to deal with before a bull rally. Let’s explore how ENA price can perform in future.
Ethena (ENA) price overview
At press time, ENA price was trading at $0.1398 with an intraday gain of roughly 40%. It has a market capitalization of $1.374B and the 24-hour trading volume is $803.608M which has increased by 300%. However, the trading volume has increased by more than 1000% which indicates that traders and investors are active. This increased trading volume can work as a catalyst in this bullish trend.
ENA price has extended to the major resistance zone: Breakout or profit booking ahead?
Ethena price chart has shown a clear and sharp move on a daily timeframe. Buyers are so strong that they have pushed the price by around 75% in just 3 days. Furthermore, the price has reached a major resistance zone of $0.140.
If the price triggers a breakout from this zone and trading volume increases then a bullish momentum can be seen. Once the Ethena price manages to sustain over the $0.140 level, buyers might be confident and can carry the bullish momentum further. Another bullish momentum from this zone can lift the price to another resistance level of $0.2633.
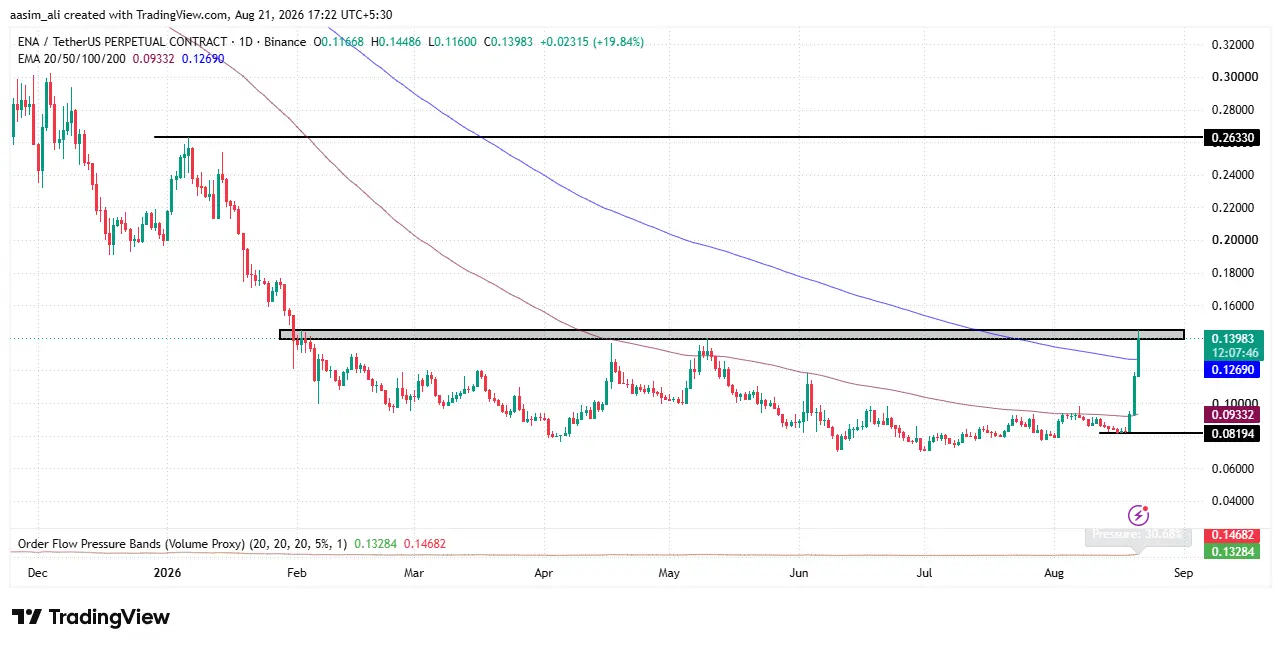
Conversely, if the asset price faces resistance from the resistance level of $0.140 then momentum can be interrupted. As we can see, ENA price has reached the resistance zone so few traders might prefer to book profit which may show bearishness. If the profit booking ratio increases, the price might slip to the 200-days EMA on a daily timeframe. Once buyers fail to defend the 200-days EMA, the price may drop to the 100-days EMA.
ENA Perpetual Futures Liquidation Trends
Liquidation data for ENA perpetuals shows a market marked by sharp, episodic volatility. Long liquidations (green) have periodically spiked well above short liquidations, notably in early June 2026, when over $4M in long positions were wiped out as ENA’s price pulled back sharply.
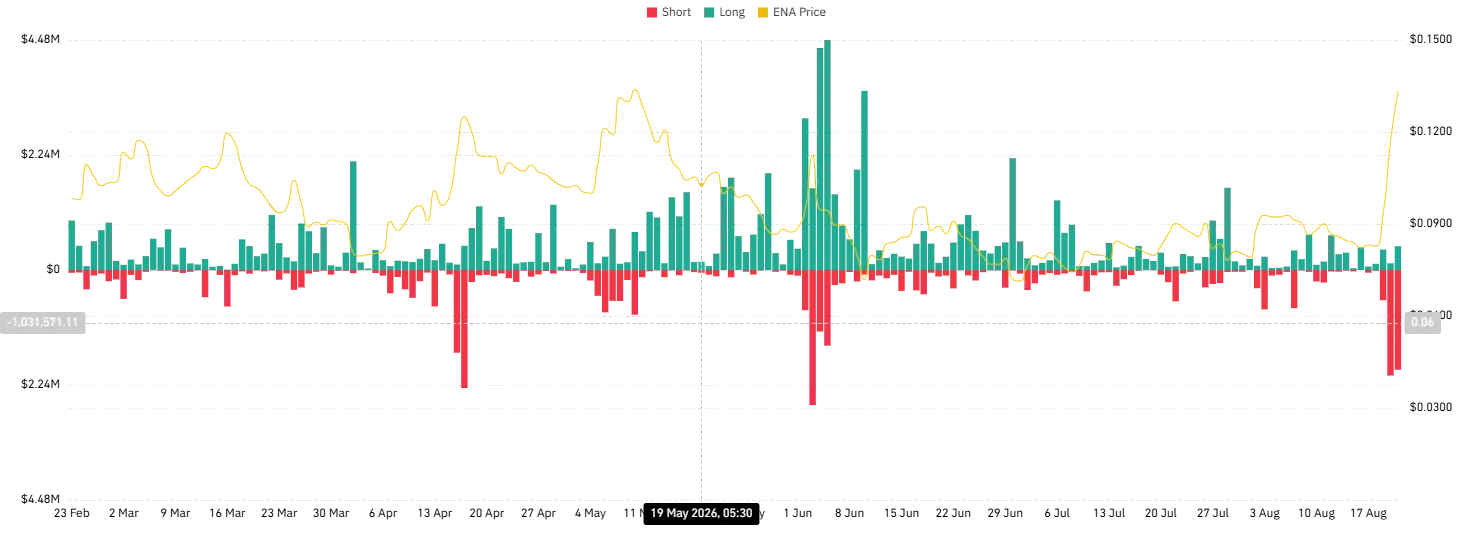
Short liquidations (red) have also seen aggressive spikes, including a notable cluster around mid-April and again in the past week (mid-to-late August), coinciding with a sharp price rally toward $0.14. This pattern of alternating long and short liquidation spikes suggests leveraged traders have repeatedly been caught on the wrong side of ENA’s swings, amplifying price moves in both directions.
Ena Open Interest
ENA has staged a sharp breakout, with price surging from around $0.078 to $0.11 in the final days of the chart, a jump of roughly 40% in a very short window. Open interest has climbed in tandem, spiking from a stable 170M-200M (till 19th August) range up to $314.66M on 21st August, signaling a fresh influx of leveraged positioning alongside the rally.
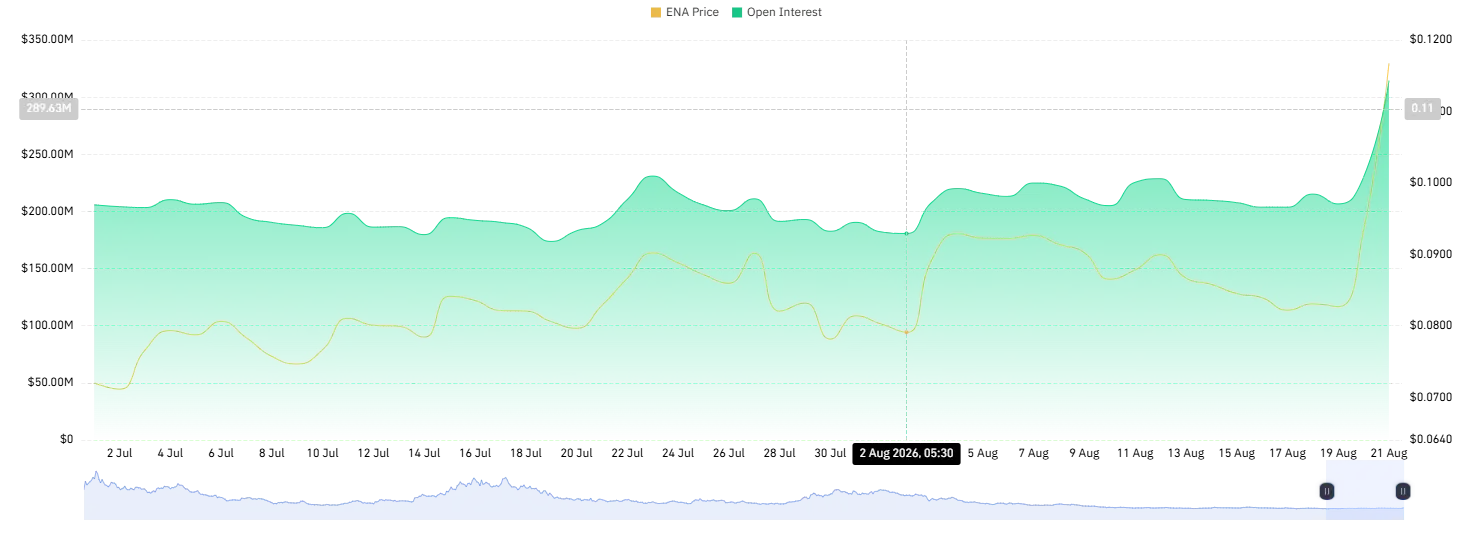
For most of July and August, price and open interest moved in a tighter band, but the late-August surge shows OI rising even faster than price, hinting at aggressive new long exposure. This combination suggests strong bullish momentum, though the rapid OI buildup also raises the risk of a leverage-driven pullback if positions get squeezed.
Final thought
ENA’s 75% rally on a 1000%+ volume surge confirms genuine buyer conviction rather than a low-liquidity spike, and the flip from bearish to bullish structure is a meaningful technical shift. That said, the $0.140 resistance zone is the pivotal level for what comes next.
A confirmed close above $0.140 with sustained volume would validate the breakout and open the path toward $0.2633, the next major resistance. Given the pace of the open interest buildup (from the 170M-200M range to over $314M in a matter of days), momentum traders are clearly positioning for continuation but that same rapid OI expansion is a double-edged sword. It raises the odds of a leverage-driven flush if the rally stalls, since a large share of recent gains is now underpinned by leveraged longs rather than spot demand alone.
On the downside, failure to hold $0.140 could trigger profit-booking, sending price back toward the 200-day EMA first, and the 100-day EMA if that support also breaks. The alternating long/short liquidation spikes on the heatmap reinforce that this is a two-sided, high-leverage market right now; sharp moves in either direction are likely to keep squeezing traders caught on the wrong side.
Why did the ENA price surge 75% in just 3 days?
The rally was driven by a sharp spike in buying momentum, with trading volume increasing by more than 1000%. This surge in participation from traders and investors pushed ENA past key moving averages and flipped the short-term trend from bearish to bullish.
What is the key resistance level for ENA right now?
ENA is facing a major resistance zone at $0.140. A confirmed breakout and sustained close above this level could open the path toward the next resistance at $0.2633.
What happens if ENA fails to break above $0.140?
If buyers fail to push through resistance, profit-booking could pull the price down toward the 200-day EMA. If that support also fails to hold, ENA may decline further to the 100-day EMA.