

Arbitrum price has witnessed a massive bullish trend and surged by 136% since mid-August. Amid this bullish trend, the price has surpassed the key moving averages which showcases the bullish sign. Trading volume and open interest have also experienced great changes with change in ARB price. Let’s connect these dots and predict the price forecast.
Arbitrum (ARB) price overview
ARB coin was trading at $0.1708 at the time of writing and remained unchanged in an intraday session. Its market capitalization was $1.175B and the 24-hour trading volume was $358.57M. It has a circulating supply of 6.678B ARB and the total supply is 10B ARB.
ARB price analysis over 1-D timeframe
Arbitrum price has been in a bullish trend and has surged by around 60% in a week. The asset price has touched the $0.20683 mark amid this bullish trend and has experienced a correction phase of around 20%. Furthermore, buyers have bounced back and are trying to convert this correction into a continuation.
Once the price manages to surpass the recent high on a daily timeframe then buyers might be confident. If the OI and trading volume increase amid this pullback, strong buying momentum can be observed.
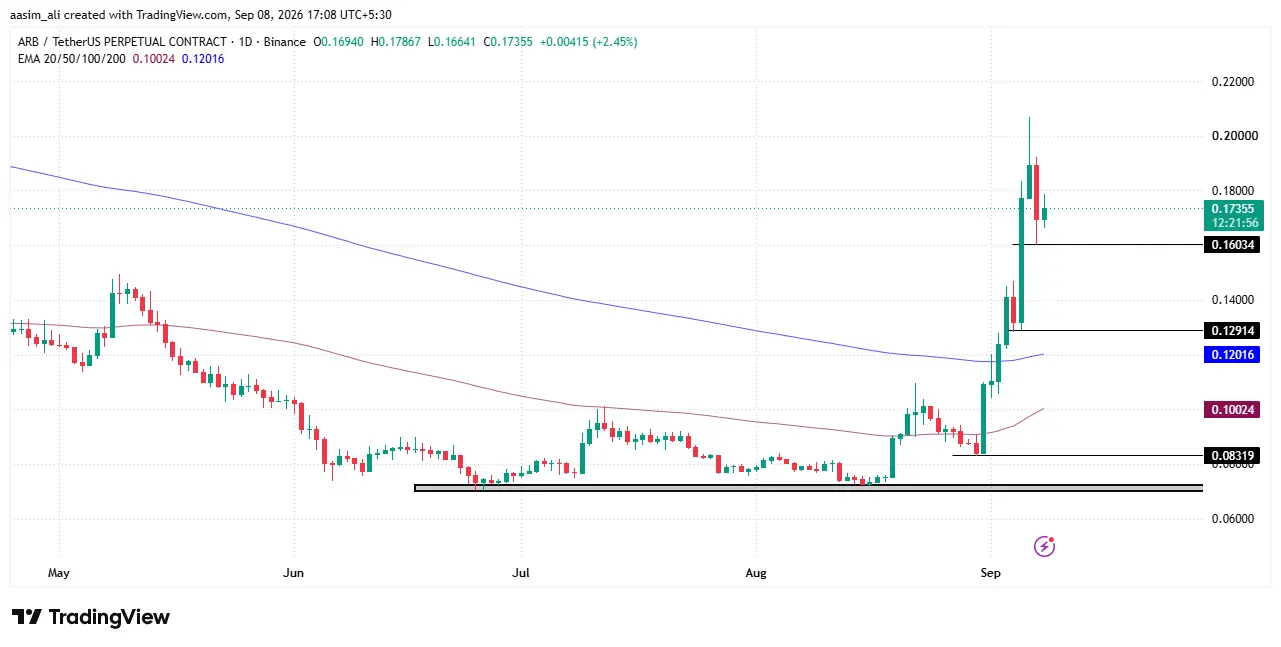
On the other hand, if Arbitrum price slips below the recent low of $0.160 then it could be a bearish signal. If the price sustains below this level, the price can make its way till the next support level of $0.130 where the price took a one day pause before that volatile bullish move.
Arbitrum price and Open Interest (OI) analysis
Arbitrum price has shown a strong bullish structure over the past month, with price rising from around $0.07 in early August to nearly $0.19 by early September, a gain of over 150%. This rally has been accompanied by a sharp rise in Open Interest, which surged from roughly $80 million through most of August to nearly $296 million by 6–8 September, indicating a substantial influx of fresh positions rather than mere short-covering.
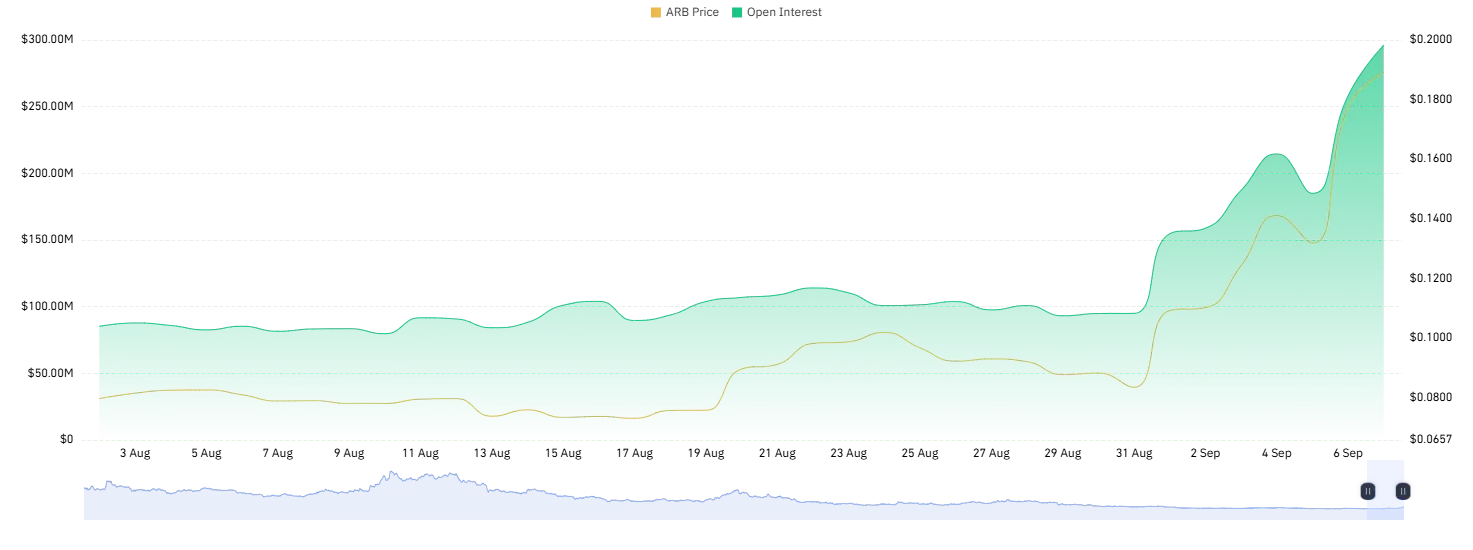
The pattern of price and Open Interest climbing in tandem, particularly during the two breakout phases (1–2 Sep and 6–8 Sep), reflects strong conviction among traders and suggests continued bullish momentum in the near term. That said, the rapid tripling of Open Interest within just a week also raises the risk of overheated positioning, which could trigger sharp volatility or a corrective pullback if the rally loses steam. Traders should watch for consolidation near current highs as a signal of the next directional move.
ARB price and Volume analysis
Arbitrum held a tight $0.072–$0.084 range through most of August, with muted volume signaling low conviction. The trend shifted decisively from late August, as price climbed to $0.10, backed by a volume uptick. The real breakout came in the first week of September: ARB surged past $0.20, and daily volume exploded from under $300M to over $2B, a nearly 7x spike, pointing to strong institutional or whale-driven buying rather than retail noise.
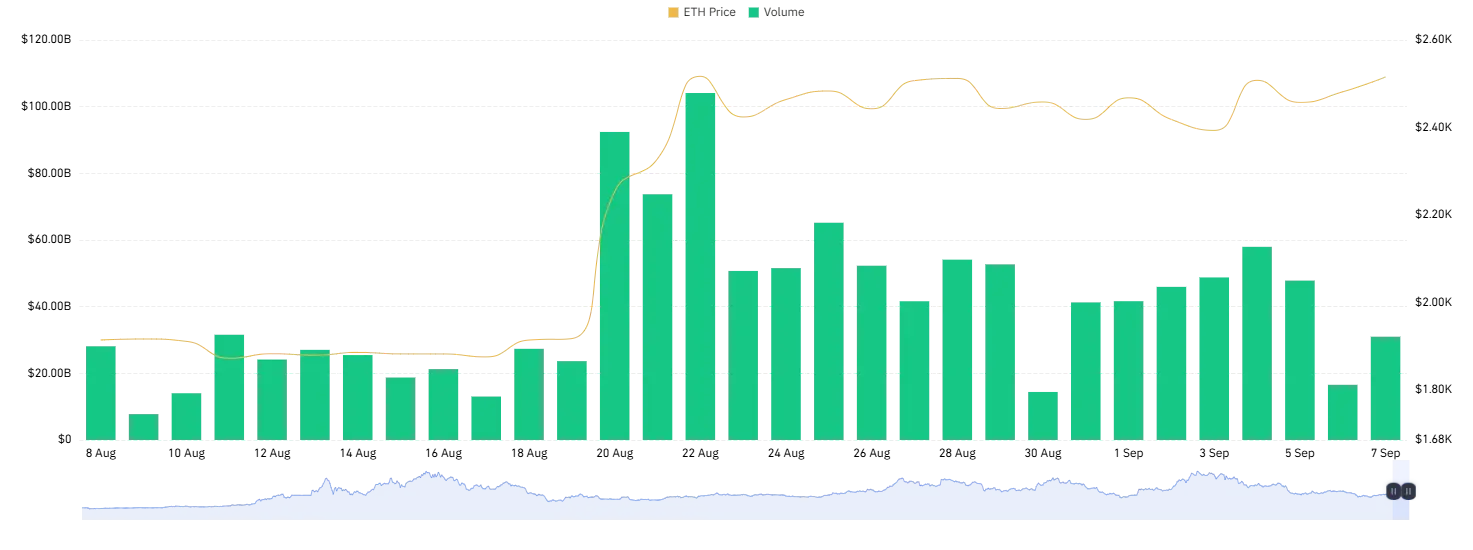
This volume-price alignment is a classic bullish confirmation signal, often preceding continuation rather than exhaustion. If buying pressure sustains, Arbitrum price could test $0.20–$0.22 in the near term, with $0.25 as a stretch target should broader crypto sentiment stay positive. However, such a sharp rally raises pullback risk toward the $0.15–$0.16 support zone if profit-booking kicks in.
Final Thought
Arbitrum price action reflects a textbook bullish continuation setup, but one that’s now entering a critical decision zone. The 136% surge since mid-August was backed by genuine conviction rather than short-covering, with Open Interest tripling and daily volume spiking nearly 7x, signs typically associated with strong institutional or whale participation rather than retail-driven noise.
That said, the current pullback from the $0.20 high needs to be read carefully. If ARB holds above the $0.160 support and reclaims its recent high with rising OI and volume, the structure favors continuation toward the $0.20–$0.22 zone, with $0.25 as an extended target if broader market sentiment stays supportive that would translate to the 70% upside referenced in the setup. However, a breakdown below $0.160 would flip the near-term bias bearish, opening the door to a retest of the $0.130 zone where the last major consolidation occurred.
Can Arbitrum price rally 70% from current levels?
A 70% move would place ARB near the $0.25–$0.29 range. This is possible if the price breaks above its recent high with rising Open Interest and volume, confirming continuation of the bullish structure.
What happens if ARB falls below the $0.160 support level?
A sustained break below $0.160 would be a bearish signal, potentially opening the path toward the $0.130 zone, the level where the earlier bullish trend had paused for consolidation.