

Arbitrum just sent shockwaves through the crypto market. ARB price surged over 29% in a single day, pushing its price to $0.1115, right at the crucial 200-day EMA. Trading volume has exploded too, nearing $430 million, signaling this isn’t just hype but genuine buying pressure fueling the move. But here’s the million-dollar question: is ARB gearing up for a breakout toward $0.150, or is this a classic blow-off top waiting to crash? Today, we break down both sides of the story.
Arbitrum (ARB) price overview
At press time, ARB coin was trading at $0.1115 with an intraday surge of 29.3%. It has a market capitalization of $744.907M with a 24-hour trading volume of $430.567M. Its circulating supply is 6.678B ARB and the total and maximum supply is 10B ARB.
ARB price analysis: Can it surge to the $0.150 mark soon?
ARB price has surged by 30% on 31st August followed by volume. Buyers have remained strong the next day and have pushed the price to the 200-days EMA on a daily timeframe. However, buyers have failed to hold and mild profit booking was seen.
As we can see, trading volume has increased amid this bullish trend which showcases that fresh entries have been made. Suppose the price triggers a breakout from the 200-days EMA on a daily timeframe, buyers might be stronger. If institutions hold their positions, the price might surge by 35% in next bullish rally to reach the $0.150 mark.
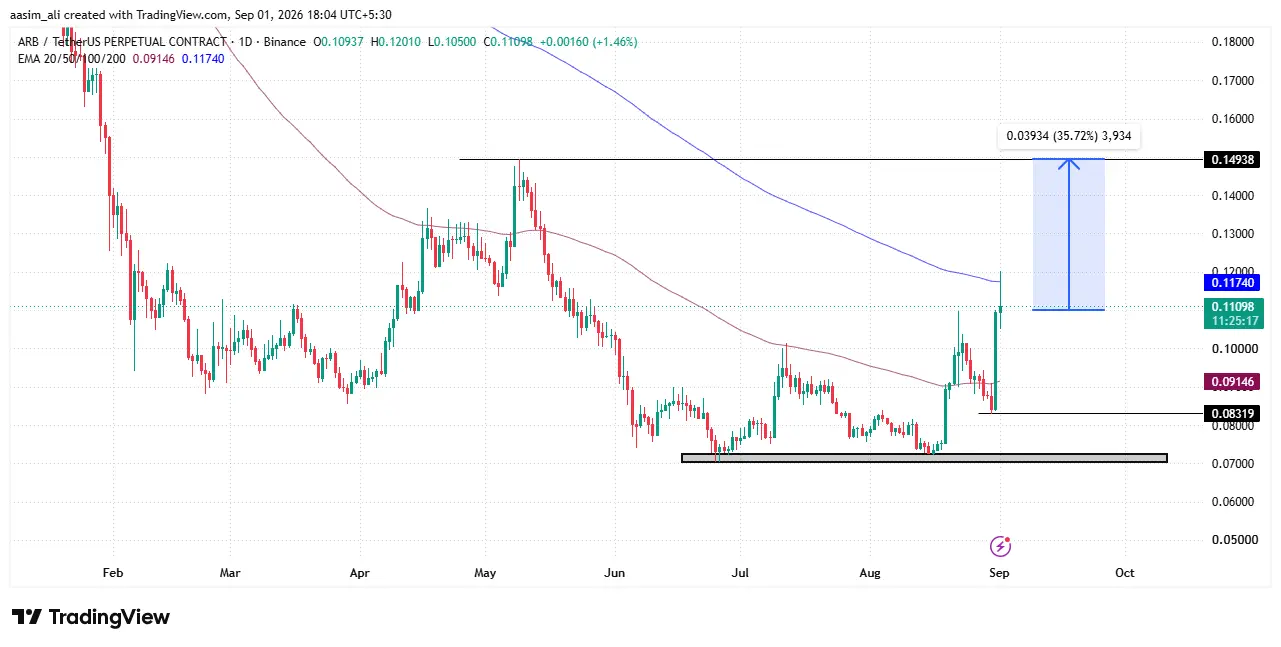
Conversely, if the stays below the 200-days EMA then sellers could lead the trend. Once big positions start squaring off, ARB price may collapse. Once the price starts trading below the 100-days EMA, the price may drop to the major support level of $0.0700.
ARB price and volume analysis
Looking at this ARB price-volume chart for August, the price started the month around $0.076, dipped to roughly $0.065 – $0.070 between August 8-9, and then began a gradual climb through the middle of the month while trading mostly sideways in the $0.072 to $0.076 range. The real turning point came around August 19-20, when price broke out sharply from about $0.075 to $0.085 to $0.090, continuing to rally until it peaked near $0.1096 around August 22.
This breakout was accompanied by a clear jump in volume, which had been flat and modest (around $60 to $100M) for most of the first half of the month but surged to nearly $200M during the same window, suggesting the move was backed by genuine buying pressure rather than thin, low-conviction trading.
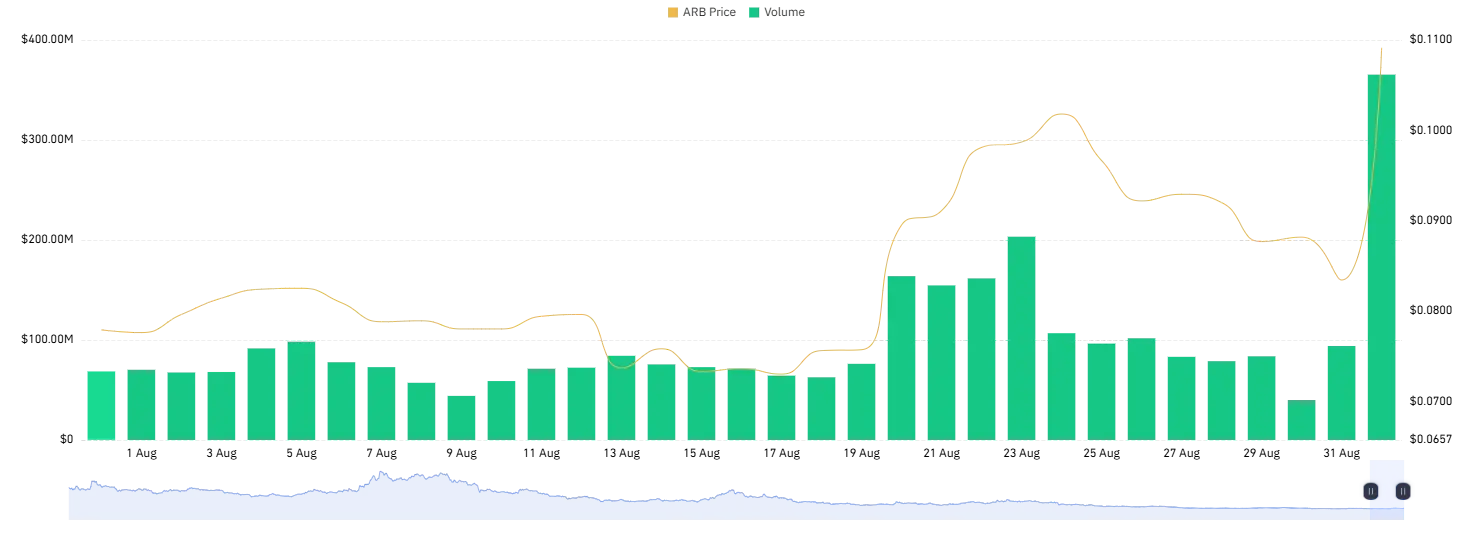
After the peak, ARB price consolidated in the $0.090 and $0.095 zone, dipped slightly toward $0.083 by August 29-30, then spiked dramatically to around $0.110 on September 01, coinciding with the largest volume bar of the month at nearly $365M (since 5:30AM IST). This kind of extreme volume spike after a sustained uptrend is a double-edged signal: it can mark the start of a stronger breakout continuation if buying interest holds, or it can represent a blow-off top where late buyers chase the price right before a pullback.
Given the pattern, if volume stays elevated above $200M in the days following August 31, the rally toward $0.13 & $0.15 would look sustainable; but if volume drops off quickly while price remains high, a retracement back toward the $0.095 $ $0.100 support zone becomes more likely.
The trading volume has increased by more than 300% as compared to the previous day. This huge surge indicates the engagement of traders and investors which may impact the ARB coin price momentum.
Arbitrum Open Interest (OI) analysis
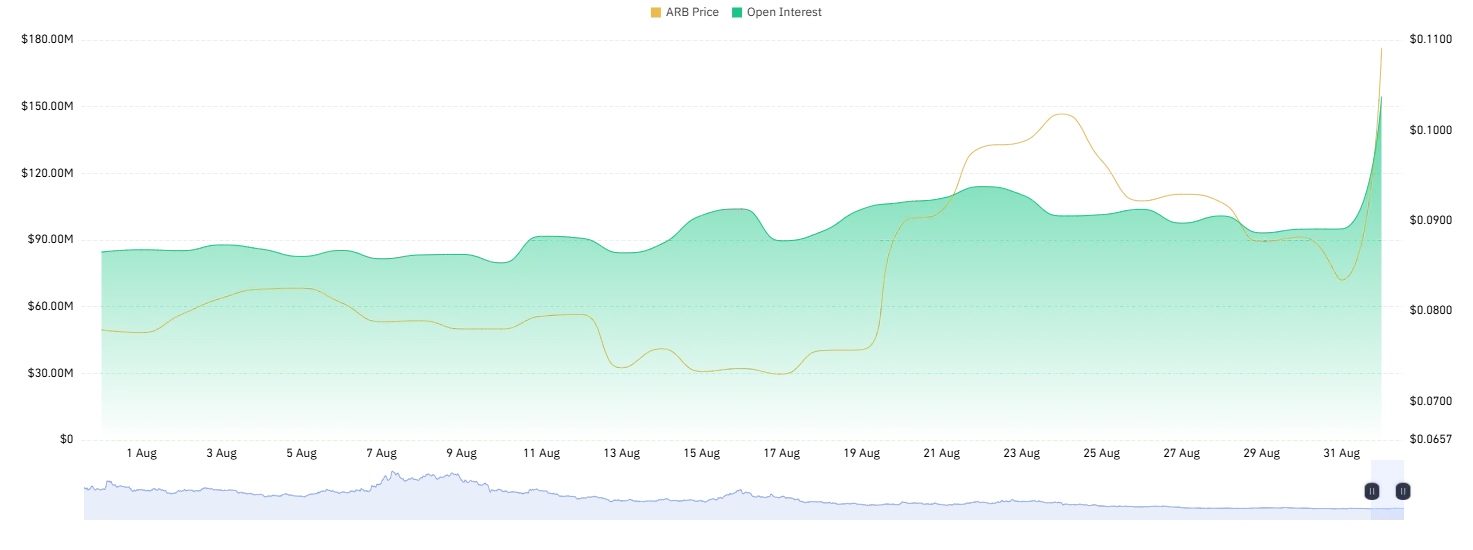
What the chart shows (Aug 1–31):
- Aug 1–17: ARB price drifted down from $0.075 to a low near $0.070, while Open Interest (OI) stayed range-bound around $70M–$95M, a fairly quiet, low-conviction phase.
- Aug 19–20: A sharp price jump from $0.070 to $0.090, with OI simultaneously spiking from $85M to $110M+, fresh positions opening alongside the move, a bullish signal (rising price + rising OI = new longs entering).
- Aug 20–25: Price pushed further to a local peak of $0.100, while OI hovered around $95M–$115M.
- Aug 25–29: Price pulled back to $0.086–$0.088 even as OI stayed elevated (~$90M–$100M), some profit-taking, but positions weren’t fully unwound.
- Aug 30–31: A sharp spike & price shot from $0.086 to $0.110, and OI exploded from $95M to $175M, the steepest joint move on the chart.
Current confirmation: This matches live data, ARB is trading around $0.114 as of today (Sep 1), up roughly 35% in 24 hours, with 24h volume near $430.567M. Arbitrum’s price triggered a strong breakout of over 30%, supported by ecosystem growth and rising trading activity, with derivatives showing a notable rise as traders opened fresh positions to extend the recovery.
Forecast considerations (not financial advice):
Bullish factors:
- The chart’s OI-price correlation (both rising together) suggests the rally is driven by fresh buying, not just short covering, generally a healthier signal than a low-OI spike.
- The broader price structure remains bullish, but ARB needs to break above $0.12 to confirm the ongoing reversal.
- Technical chatter has been fixated on whether ARB can break above the $0.0899–$0.10 resistance zone, which it has now cleared, turning that zone into potential support.
Bearish/risk factors:
- Such a sharp, fast move (30%+ in a day) often sees some retracement as short-term traders take profits.
- Arbitrum has another major token unlock scheduled for September 23, 2026, with around 139 million ARB expected to enter circulation, roughly 1.4% of total supply, which could create selling pressure.
- High OI after a vertical move also means more leveraged positions that can unwind quickly if price reverses, potentially amplifying volatility in either direction.
Final Thought
ARB’s 30% breakout, backed by a genuine 300%+ volume surge and rising Open Interest, points to a rally driven by fresh conviction rather than a short squeeze, a technically healthier setup than most vertical moves. Clearing the $0.0899–$0.10 resistance zone and flipping it into support is a meaningful structural shift. But the size and speed of the move leave it vulnerable to profit-booking, and the September 23 token unlock (1.4% of supply) adds a fresh supply-side risk into the mix.
A decisive close above $0.12 would strengthen the case for $0.13–$0.15; failure to hold above the 100-day EMA reopens the door to $0.083 support. In short, the trend has turned constructive, but confirmation, not the spike itself, is what will decide whether this is a breakout or a blow-off top. As always, this is analysis, not financial advice.
Why did ARB price surge 30% in a single day?
The surge was driven by a sharp increase in trading volume (up over 300% to nearly $430M) and rising Open Interest, indicating fresh buying pressure and new long positions entering the market rather than just short covering.
What price level does ARB need to break to confirm a bullish reversal?
ARB needs to break above $0.12 to confirm the ongoing reversal. The $0.0899–$0.10 zone, which was previously a key resistance level, has now flipped into potential support.
Can ARB price reach $0.150?
If ARB triggers a breakout from the 200-day EMA and institutions hold their positions, the price could rally roughly 35% to reach the $0.150 mark. This depends on trading volume staying elevated above $200M in the days following August 31.