

Akedo price has witnessed a significant move on a daily timeframe. Akedo’s price has continued its upward trajectory, reaching a new all-time high. The price has skyrocketed by more than 7000% in just 2 months. Amid this bullish momentum, the funding rate and volume have displayed great changes in an intraday session. Let’s explore the possible outcome of the Akedo coin.
Akedo (AKE) price overview
At press time, Akedo coin was trading at $0.01361 with an intraday gain of 58.3%. It has a market capitalization of $313.197M and the 24-hour trading volume has increased from $23.46M to $193.956% in a day. It has a circulating supply of 22.796B AKE and the total and maximum supply is 100B AKE.
Akedo price climbed by 58% in a day: Can it hit the $0.0500 mark soon?
Akedo price has remained extremely bullish on daily timeframe. It has been in a bullish trend since mid-July and has surged by 7000% till now (Sept 02, 2026). Amid this bullish trend, the Akedo price has recorded an all-time high of $0.03638 on September 02.
According to the chart structure, the Akedo price has triggered a pullback after a small correction phase on a daily timeframe. After this correction, the price has surged by around 58.3% in less than 24 hours. Amid this bullish momentum, the trading volume has surged by more than 700%. The massive spike in the trading volume indicates that fresh positions have been made.
The overall trend was extremely bullish at the time of writing and the price has triggered a bullish pullback. This might be a sign that the Akedo price could continue the bullish trend. If the trending volume remains almost constant, the price could hit the $0.0500 mark amid this bullish trend.
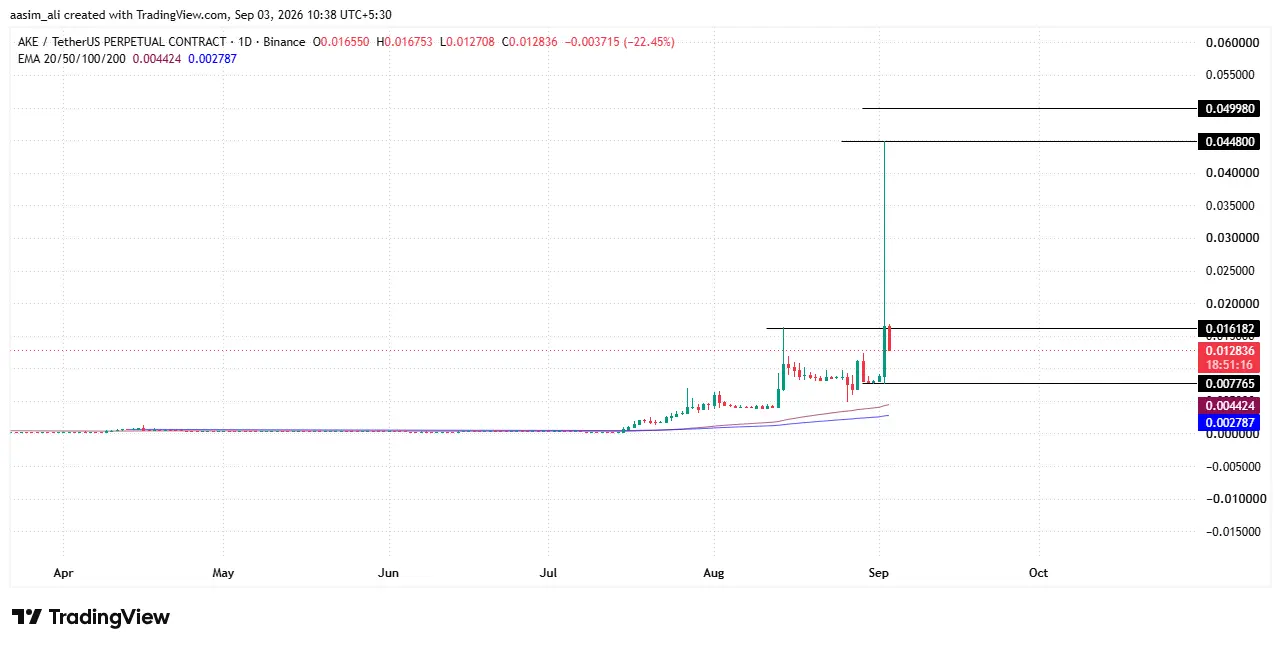
Conversely, if most of the traders and investors prefer to book profit after this massive spike then Akedo price might drop slightly. However, if the profit booking trend continues then a dump can be seen.
Akedo OI-Weighted funding rate
The AKEDO OI-weighted funding rate chart from 28 August to 2 September shows a market that shifted from calm to sharply leveraged in the final stretch. Funding stayed mildly positive (roughly 0.0067% to 0.0081%) through 28–29 August before flipping abruptly negative to around -0.06% on 29 August, a sharp but short-lived move suggesting a liquidation event or aggressive short positioning.
From 30 August through 1 September, funding flattened out near -0.0085%–0.0106% alongside low volatility and a gently declining price hovering between $0.0081 and $0.0087, indicating a period of consolidation with little directional conviction. Momentum then returned starting 1 September, with funding climbing through several peaks (0.0071%–0.0107%) before spiking sharply to roughly 0.0108% on 2 September, the highest reading across the entire window.
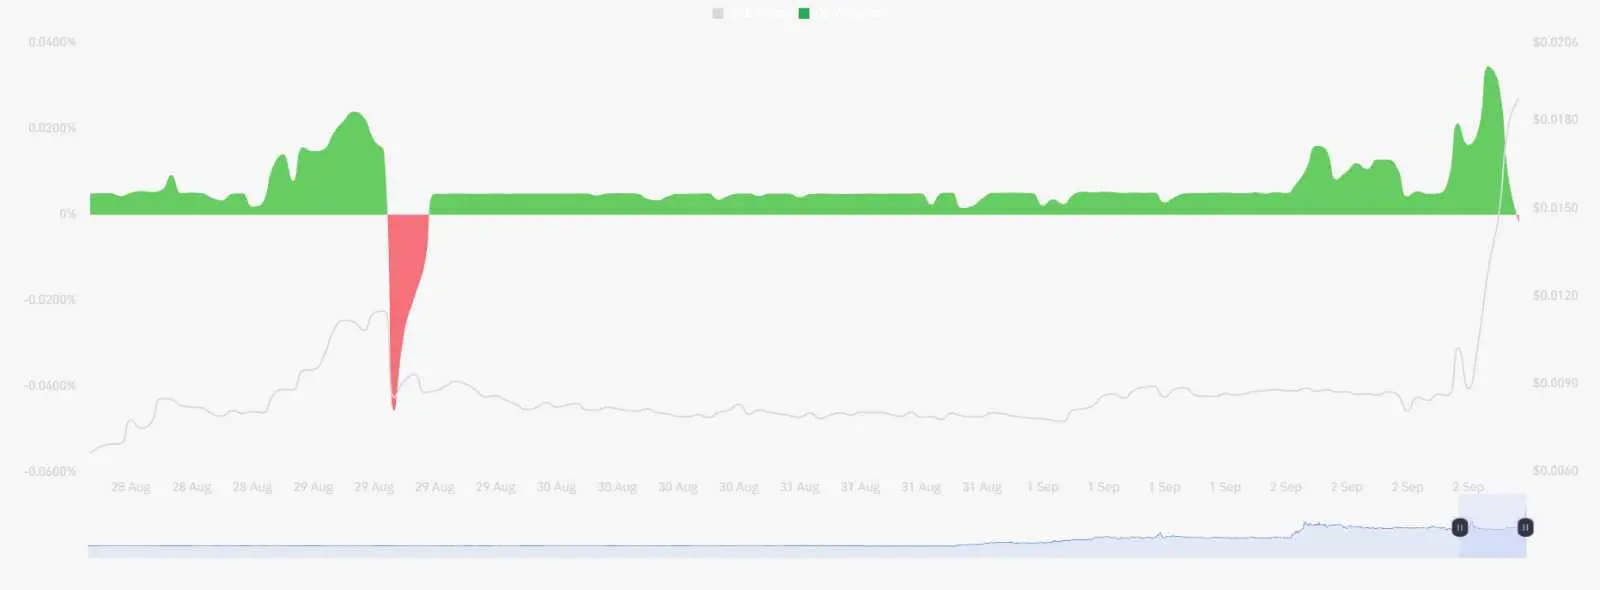
This funding spike coincided with a price breakout to around $0.01800 and a visible rise in open interest, pointing to a surge in leveraged long positioning driving the rally. Shortly after, funding collapsed back toward baseline as price retraced to about $0.015, a pattern consistent with an overheated long-side market cooling off after a squeeze.
For a price prediction piece, this sequence suggests the recent rally was largely leverage-driven rather than organic demand, meaning further upside could be vulnerable to a similar funding-driven pullback unless fresh spot demand steps in to sustain the move.
Final Thoughts
Akedo’s blowout rally to a new all-time high looks driven more by leverage than by fresh spot demand. The OI-weighted funding rate tells the real story: after days of flat, low-conviction trading, funding spiked sharply alongside the breakout and open interest jumped in tandem, a classic signature of traders piling into leveraged longs rather than organic buying pressure. That kind of move tends to be self-limiting. Once funding gets that stretched, it usually snaps back as overleveraged longs get squeezed out, which is largely what played out as price retraced from the highs.
For AKE to sustainably push toward $0.0500, the rally needs to be picked up by spot demand rather than perpetual speculation, watch for funding cooling back toward neutral while price holds its gains, which would suggest the move is being absorbed by real buyers rather than unwinding. If instead funding stays elevated or spikes again on any bounce, that’s a signal the move is still leverage-fueled and vulnerable to another sharp flush. Given the token’s youth and thin liquidity relative to its market cap, volatility in both directions should be expected, and traders should size positions accordingly.
Why did Akedo price surge over 7000%?
The rally stems from a sustained bullish trend since mid-July, culminating in a fresh all-time high. The most recent leg, a 58.3% single-day gain, coincided with a sharp spike in trading volume and a surge in leveraged long positioning, based on OI-weighted funding rate data.
Is Akedo’s current rally driven by real demand or leverage?
The funding rate data suggests the rally is largely leverage-driven. Funding spiked sharply alongside the breakout and rising open interest, a pattern typically associated with traders piling into leveraged longs rather than sustained spot buying.
Can Akedo price reach $0.0500?
It’s possible if trading volume stays elevated and the bullish trend holds. However, this target depends on fresh spot demand stepping in; if the rally remains leverage-fueled, it’s more vulnerable to a sharp pullback.