

Bitcoin price surged by around 25% in August and has exceeded the $80,000 level amid this bullish trend. BTC price has surpassed the key moving averages after the bullish rally. The price has been hovering near the psychological level of $80K for the past 20 days. A change in trading volume was also spotted during this rally. Let’s explore the further data and predict the Bitcoin price forecast.
How does Bitcoin work?
- Decentralization: No central bank or single owner manages Bitcoin. A global network of computers runs the system.
- Blockchain: Every transaction is saved on a public digital ledger called a blockchain.
- Mining: Special computers solve hard math problems to confirm transactions and add them to the blockchain. This process creates new Bitcoin.
- Limited Supply: Only 21 million Bitcoins will ever exist, which makes it scarce like gold.
Key Features
- Digital Only: Bitcoin has no physical form; it exists only as code on a network.
- Pseudonymous: Users do not need real-name bank accounts, though all public transactions can be viewed on the blockchain.
Bitcoin (BTC) price overview
At press time, Bitcoin was trading at $78,141.87 with an intraday fall of 1.4%. Its market capitalization was $1.565T and the 24-hour trading volume was $32.643B. Its circulating and total supply is 20.082M BTC while the maximum supply is 21M BTC.
Bitcoin price analysis over 1-D timeframe
Bitcoin price has witnessed strong buying pressure since mid August. Amid this bullish trend, the price has surged to $82,282 and experienced mild selling pressure. After this bullish trend, the price is struggling in a narrow range of $76,650 and $81,230 for the past 20 days.
If the price triggers a breakout from this narrow range, buyers might become confident again. Once the Bitcoin price closes over the $81230 on a daily timeframe, a strong bullish trend can be seen. If this bullish movement is supported by trading volume and Open Interest (OI), the price may extend to the $90K level.
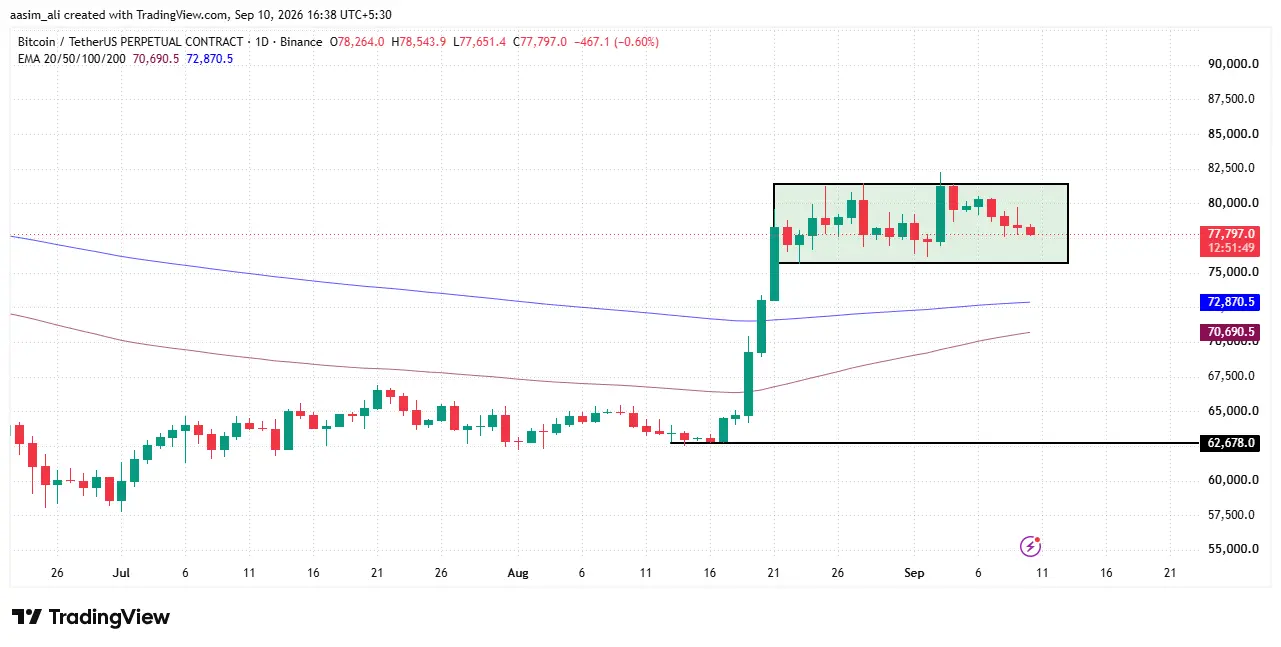
Conversely, if Bitcoin price slips below the $76650 level then the price could result in a deeper correction. Losing this narrow zone can drag down the price to the 200-days EMA. Once the Bitcoin price starts trading below the 200-days EMA, the price may melt to the demand zone of $62,678-$64000.
Bitcoin price and volume analysis
Bitcoin price traded in a range of roughly $63,497.00 to $70,450.00 from Aug 4–19, with moderate volume ($54.66 to $41.93B). A sharp breakout occurred around Aug 20–22, when price jumped from $68,882.10 to $78,831.10, accompanied by a massive volume spike ($161B on Aug 22), signaling strong buying momentum.
Post-breakout, price consolidated in the $76,268.00 to $80,282.00 band through late August and early September, with volume cooling but staying elevated ($60B–$90B), suggesting accumulation. A second volume surge near Sep 3–5 pushed price briefly toward $76,927.00 , followed by a mild pullback to $70,737.00 by Sep 9.
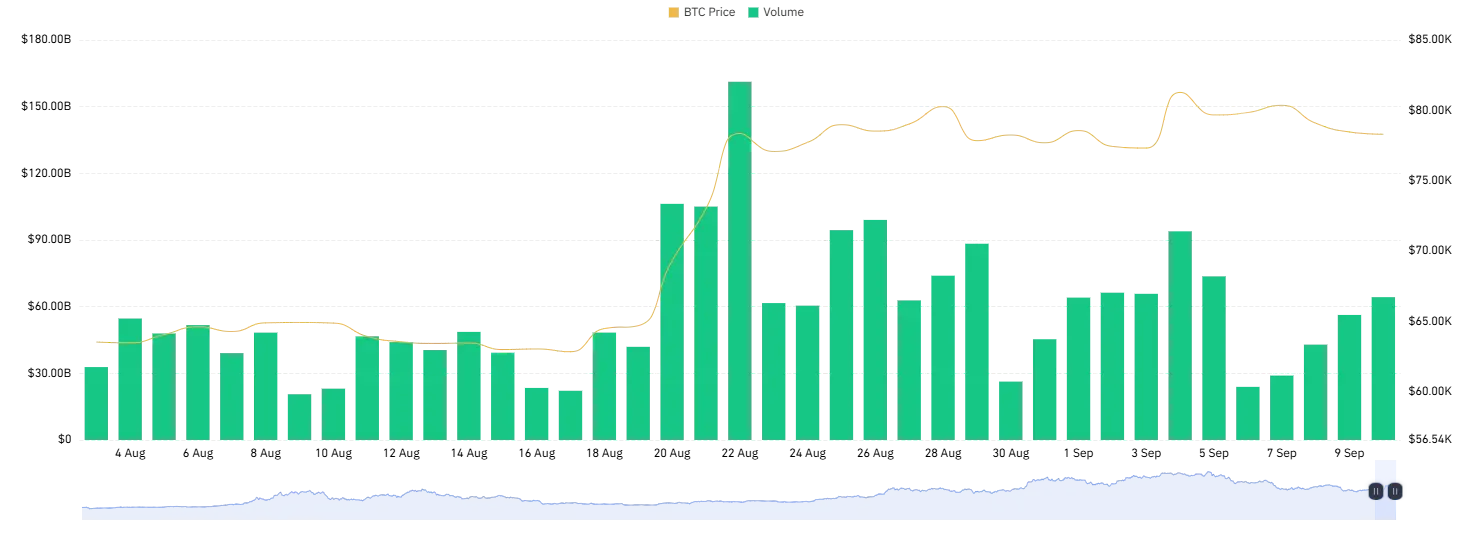
Prediction outlook: The pattern (breakout + sustained high volume + higher-low consolidation) is bullish, hinting BTC could retest $80K–$85K if volume picks up again. However, declining volume during consolidation is a caution sign, a drop below $76K support could trigger a deeper correction toward $70K. This is a technical read, not financial advice.
Final Thought
Bitcoin price action reflects a market pausing to digest a sharp August rally rather than reversing it. The narrow consolidation between $76,650 and $81,230 suggests traders are waiting for a fresh catalyst, whether from ETF flows, macro cues, or on-chain accumulation data, before committing to the next big move.
A decisive daily close above $81,230 with strong volume could reignite bullish momentum toward $90K, while a breakdown below $76,650 risks a deeper slide toward the 200-day EMA and the $62,678–$64,000 demand zone. Until volume convincingly returns, sideways trading is likely to persist. As always, this remains a technical outlook, not financial advice.
Why is Bitcoin trading in a narrow range after its August rally?
After surging around 25% and crossing $80,000, BTC is consolidating as traders await a fresh catalyst, be it ETF inflows, Fed policy signals, or on-chain accumulation trends, before pushing the price decisively higher or lower.
What price level would confirm a bullish breakout for Bitcoin?
A daily close above $81,230, backed by strong trading volume and rising Open Interest, would signal renewed buyer confidence and could open the path toward the $90,000 level.
What happens if Bitcoin breaks below the current support zone?
A slip below $76,650 could trigger a deeper correction, dragging price toward the 200-day EMA and potentially into the $62,678–$64,000 demand zone if selling pressure builds.