
The crypto market’s total value, known as the total crypto market cap, is one of the most important metrics in the digital asset market; a single number capable of quantifying the worth of all digital currencies existing at a particular point in time.
However, expert traders and analysts know it very well that only a single number doesn’t tell the whole story. In order to get deeper insights regarding the real market movements, one has to look into three main indices: TOTAL 1, TOTAL 2 & TOTAL 3. But what exactly are these, and how do they impact the crypto market? Come, let’s understand.
What is the Total Crypto Market Cap?
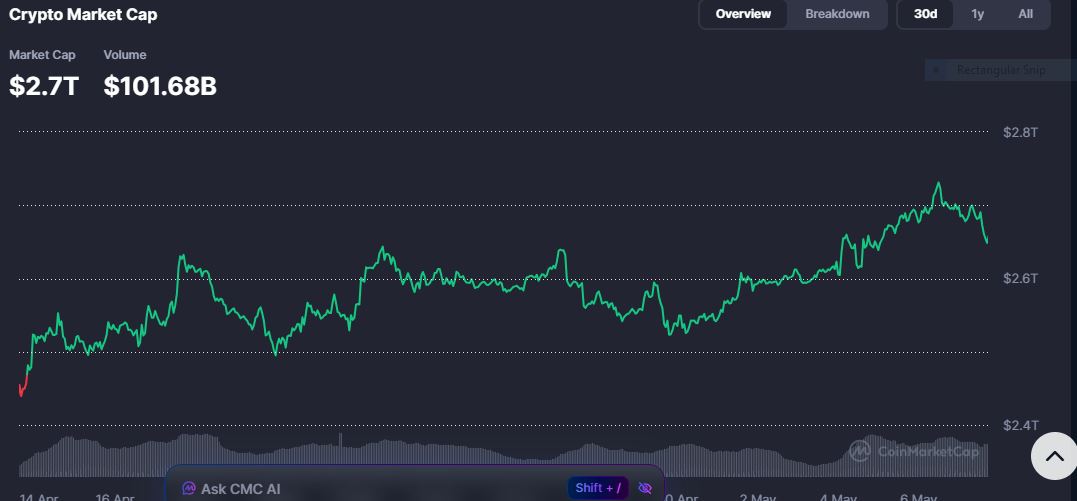
In basic terms, total crypto market cap is the sum of the values of every crypto’s circulating supply multiplied by its value/price at a specific time. According to CoinMarketCap’s data, the global total market cap, as of May 2026, is $2.74–$2.81 trillion (all the cryptocurrencies together).
This is after a big drawdown period wiped out more than $900 billion, or 20.4% of the market’s total value in 90 days in Q1 2026. The market capitalization hit an all time high in late 2025, topping the $4 trillion figure, and has been reverting to the mean level. It’s important to interpret this number in context: increasing total market cap typically indicates inflows of capital and investor sentiment, while decreasing to a lower amount could mean it’s risk-off or that investors are rotating the capital out of crypto altogether.
What Is TOTAL 1?
TOTAL (usually known as TOTAL 1) is the widest of the three indices mentioned above. It monitors the market capitalization of the very best cryptocurrencies that feature Bitcoin, Ethereum, major altcoins, and even USDT and USDC, which are the two largest stablecoins. This means TOTAL 1 is the genuine voice of the entire crypto ecosystem. An interesting exception to keep in mind is that, as of May 2026, stablecoins made up more than $319 billion of the total market cap.
Because stablecoins don’t reflect speculative risk-on behavior, some analysts argue that the raw total market capitalization figure can be misleading. For example, Bitcoin’s dominance over total crypto market cap currently sits at approximately 58.3 — 60.3%, meaning a single asset commands more than half the entire market’s value. And therefore, TOTAL 1 can be at best termed as a macro indicator, it provides you with an overview of the overall state of health of the crypto industry. But for deeper analysis, one needs the other two indicators.
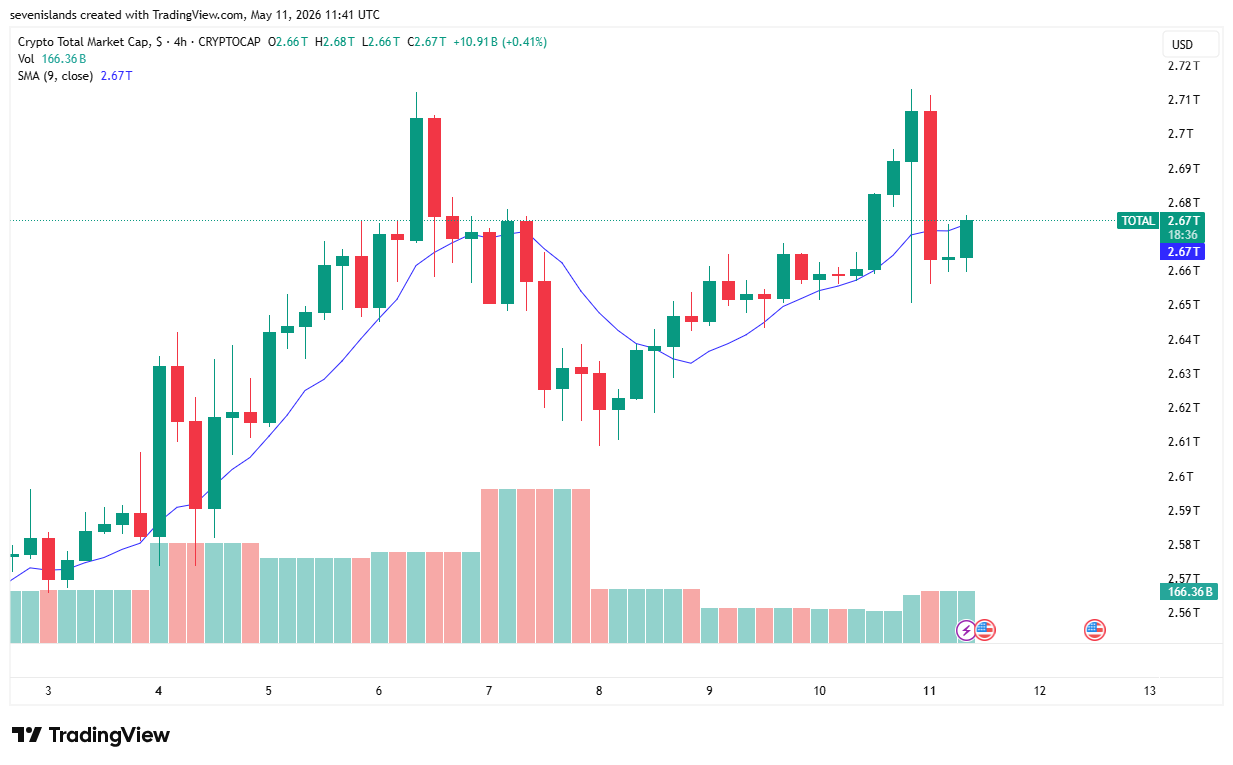
Image: TOTAL 1 Chart
What Is TOTAL 2?
In this case, Bitcoin is removed from the equation. It shows the overall market size of all cryptocurrencies placed together from Ethereum down to smaller cap currencies, excluding BTC. It provides traders with a reliable insight for the performance of the altcoin market, independent of Bitcoin’s strong influence. As of May 2026, the Total 2 index currently sits in the $1.03–$1.06 trillion, holding above a key weekly support zone near $0.9T–$1.05T.
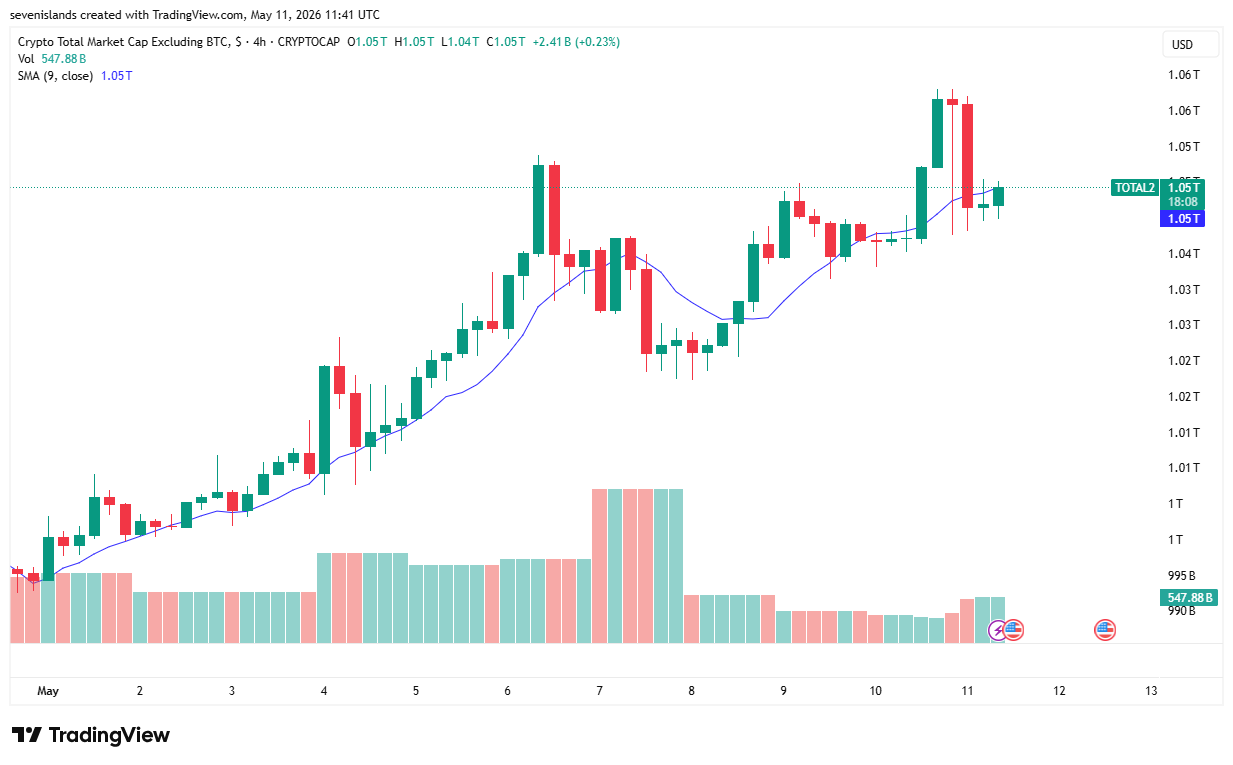
Image: TOTAL 2 Chart
Ethereum’s dominance in this index has remained consistent: earlier in the cycle, ETH made up around 30% of the Total 2 alone, so price movements of Ethereum have an amplified impact on the altcoin reading in general. Analysts and traders can watch for rotation events or when capital moves out of Bitcoin and into the altcoin market by looking at the total market capitalization, excluding BTC. When Total 2 is increasing and Bitcoin is flat or declining, it’s normally a preliminary indication of a new momentum in the Altcoin market.
What is TOTAL 3?
Total 3 explores the concept of segmentation of the total crypto market cap even deeper, and excludes both Bitcoin and Ethereum from its look at the market, only measuring the smaller and mid-cap altcoins’ market cap. This makes it what many traders call the purest “Altseason index”: an indicator of speculative appetite for higher-risk, higher-reward assets.
TradingView data indicates that as of May 2026, the total crypto market cap of Total 3 stands at around $766.2B. With Total 3 rising and Total 2 almost flat, it is a clear indication that smaller altcoins are outshining Ethereum; a typical example that proves investors are taking the path towards lower risks and higher gains. On the contrary, when the Total 3 underperforms, capital tends to be concentrated in BTC and ETH rather than speculative plays.
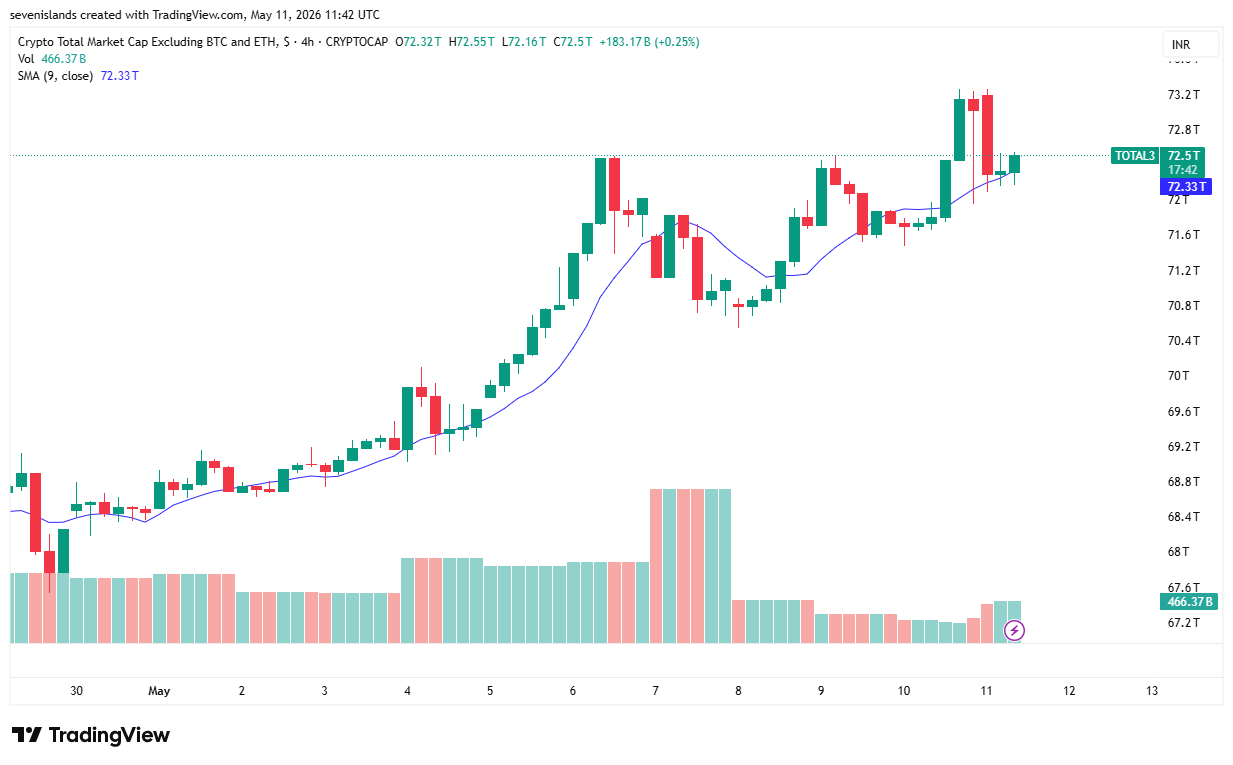
Image: TOTAL 3 Chart
How do traders use TOTAL 1, TOTAL 2 & TOTAL 3 together?
As discussed before too, smart traders usually aren’t only considering one crypto index. They apply them all simultaneously to decipher the condition of the market in the cycle. In practice, traders use each index in the following manner:
- Capital rotation follows a hierarchy. As always, Bitcoin is on top (as seen in Total 1), followed by Ethereum and other tokens in the major caps range (as seen in Total 2 going up), and finally, all the capital pours into the small cap tokens (Total 3 jumping). Traders use this chain for indications of entry, i.e., to determine when to get in on the next level.
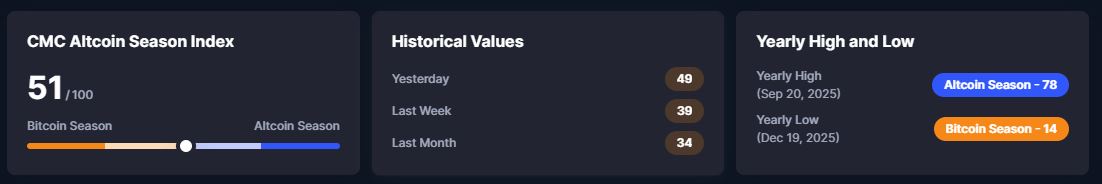
- Current market status (May 2026). Bitcoin dominance is just 58–60% with Altcoin Season Index at 50-51 of 100, and the market stays firmly in “Bitcoin Season” territory, where Bitcoin has yet to finish the switch to Total 2 and Total 3 territories.
- Technical analysis is applied to all three. Traders regard TOTAL, Total 2 and Total 3 as their own assets from which they take support/resistance levels, trend lines and watch moving averages. In the broad term, a break of the 200-week moving average on Total 2 from the 20-week chart that serves as a support level is considered a macro bull market signal for the altcoins.
- Divergences between indices reveal opportunities. When both the totals are increasing, it indicates that the price of both the cryptocurrencies and the altcoins are rising as a whole. When Total 1 (Overall total crypto market cap) is constant but Total 2 is increased, it means that the prices of more cryptocurrencies except Bitcoin are increasing as a whole. When Total 3 increases and Total 2 remains flat you will see smaller and lesser known altcoins outperform Ethereum, which is always a high-risk/high-return scenario.
- Risk management and investment allocation. Traders increase altcoin exposure when Total 2 and Total 3 show strong upward momentum relative to Total 1, and reduce it when Bitcoin dominance is expanding — using the indices together as a top-down framework for sizing positions across the entire total crypto market cap spectrum.
Why are TOTAL 2 and TOTAL 3 critical for identifying Altseason?
One of the major use cases of these indicators is determining when the period of Altseason starts. Historically, capital rotates in a predictable pattern that is visible directly through changes in the total market cap distribution. Each subsequent Bitcoin halving seems to see liquidity drain away from Bitcoin and into the overall altcoin market, generating significant trends in both Total 2 and Total 3 indicators. The 2021 altcoin cycle is a well-documented example: Total 2 and Total 3 both saw multi-hundred-percent gains as capital rotated aggressively down the market cap ladder.
One significant chart formation on which analysts are going to be paying close attention this year is a base in the altcoin market cap that looked strikingly similar to the pattern established in 2016 and 2019, which saw explosive rallies in the altcoins. For the current cycle, confirmation would require Bitcoin dominance to drop decisively from its 60%+ levels and for the Altcoin Season Index to push above 75/100. However, both Total 3 and Total 2 are near long-term support levels, and will be held in a holding pattern until those signals materialize. Currently, the Altseason index stands at 51/100.
Conclusion
While knowing the total crypto market cap is vital for any serious crypto investor, it’s the combination of all three crypto market cap indicators that truly makes a difference. Total 1 provides a big picture of the overall industry. Total 2 separates out cryptocurrencies other than Bitcoin. Total 3 drills down further into the smaller, more speculative segment of the market that tends to deliver the highest returns.
Disclaimer: Crypto products and NFTs are unregulated and can be highly risky. There may be no regulatory recourse for any loss from such transactions.
What is the current total market cap?
The current total market capitalization as of 11th May 2026 is $2.7T.
Is it the right time to buy Bitcoin now?
Yes, it is an ideal time to buy Bitcoin in India
How to start investment in BTC with just ₹100?
In SunCrypto, you can you start your Bitcoin investment with just ₹100.