
XRP price has been in a bullish trend since mid August and has surged by more than 50%. XRP price has triggered a breakout from a resistance zone and has displayed mild retracement. However, the price was holding over the breakout zone which showcases the bullish forecast. It has the potential to gain 40% if the cryptocurrency market remains bullish for the next few weeks. OI and volume has also increased during this breakout which might be a bullish signal.
What is driving the XRP price beyond the charts?
- Regulation: A Court Win, but No Law Yet
Ripple won its SEC case, but that win was a district court ruling, not a statute. Traders hoped the CLARITY Act would make that clarity permanent. On 15 September, the Senate voted 49-50 against opening debate on the bill, 11 votes short of the 60 needed. XRP fell nearly 8% after the vote. The vote was procedural, so the bill is not permanently dead. Ripple CEO Brad Garlinghouse expects the SEC and CFTC to keep making rules to fill the gap.
- ETF Demand: Steady Inflows, Volatile Returns
US spot XRP ETFs have pulled in about $1.72 billion in cumulative inflows and hold about $1.40 billion in net assets. Money kept flowing in even as XRP slipped from its late-summer highs. Inflows have not shielded investors from swings, though. The first US XRP ETF, XRPR, has lost about 60% since its September 2025 launch.
- RLUSD and the XRP Ledger
Ripple’s RLUSD stablecoin crossed $2 billion in market cap in August, with about $963 million issued on the XRP Ledger. It is backed 1:1 by cash and equivalents, with monthly Deloitte attestations. This shows growing institutional use of the ledger, but it does not directly increase demand for XRP. XRP’s only role in that activity is collecting network fees.
- Network Activity and Supply
Daily payment volume on the XRP Ledger topped 1.1 billion XRP in September, more than double the 30-day average of 494.6 million. On the supply side, 62.879B XRP is in circulation out of 99.986B total, with a hard cap of 100B.
XRP Price Overview
At press time, XRP coin was trading at $1.49 with an intraday loss of 7.7%. Its market capitalization was $93.676B and the 24-hour trading volume was $5.772B. Its circulating supply is 62.879N XRP and the total supply is 99.986B XRP while the maximum supply is 100B XRP.
XRP Price Technical Analysis Over 1-D Timeframe
XRP price has triggered a breakout from a resistance level of $1.48. It witnessed 10% up move post breakout but failed to continue. Furthermore, it has come back to the breakout zone for retest.
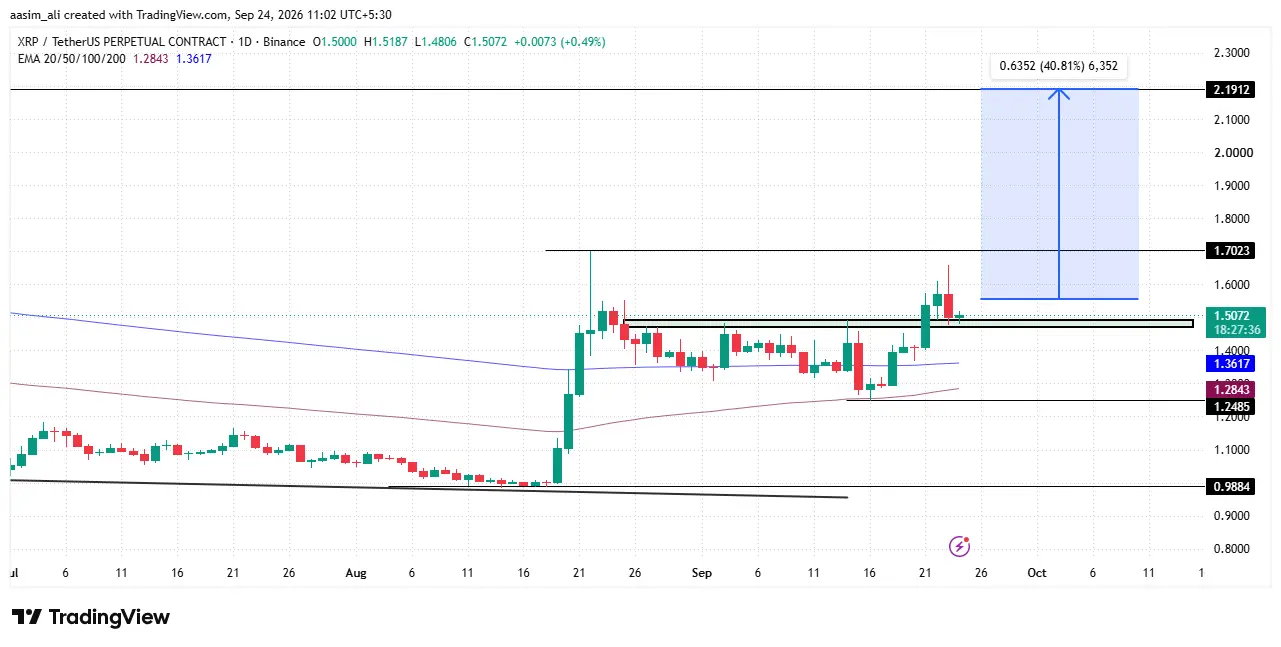
If XRP price rises and closes over the previous day opening on a daily timeframe, buyers might dominate. Furthermore, if the price closes over the previous day high, buyers might lead the trend and we can see a bullish rally of around 40% in the next few weeks. If BTC remains bullish then the XRP price could touch the resistance level of $2.2 mark.
Conversely, if traders and investors prefer to book profit after the recent bullish momentum then sellers could dominate further. If XRP price slips below the $1.48 level which has turned to support after breakout then it would be difficult for buyers to bounce back.
XRP Price Analysis: Volume Surge Signals Bullish Momentum
XRP’s price action from late August to September 2026 shows a classic accumulation-to-breakout pattern. After declining from $1.55 to a low near $1.24 in early September, XRP consolidated in the $1.30–$1.45 range for nearly two weeks, backed by moderate trading volume ($2B–$5B daily).
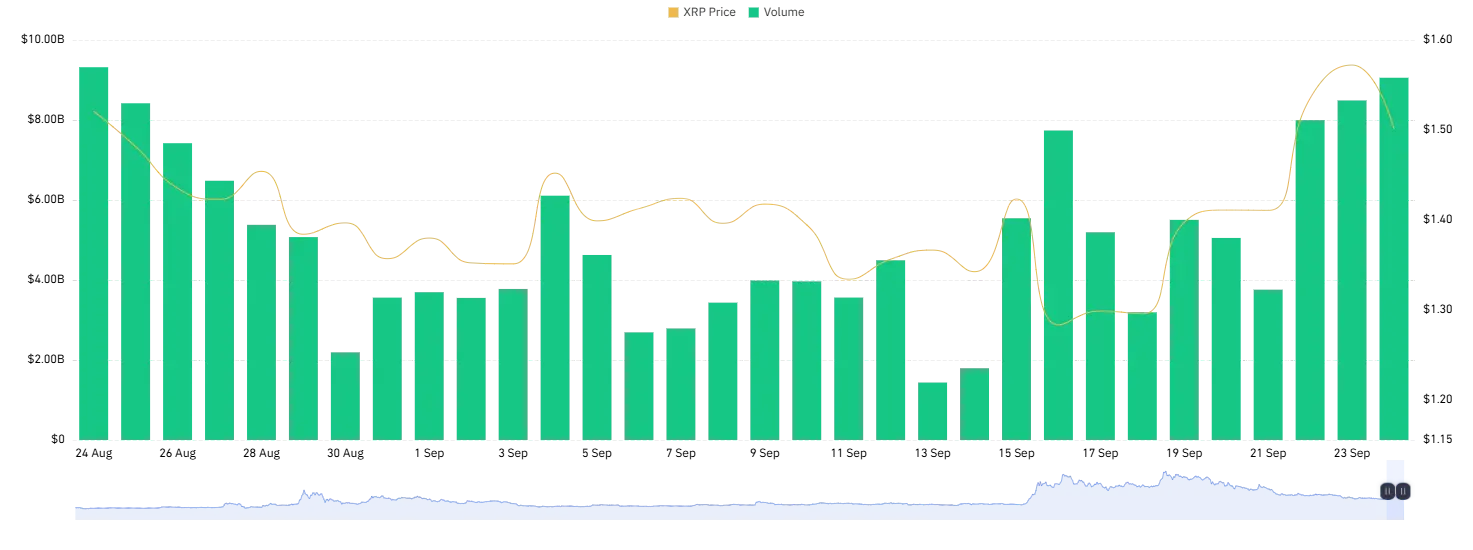
The key signal comes from September 15 onward: trading volume spiked sharply from under $2B to over $7.5B, coinciding with a strong price rally from $1.24 to $1.65. This volume-price correlation suggests genuine buying pressure rather than a speculative spike, indicating institutional or whale accumulation.
Price Prediction: If volume sustains above $6B, XRP price could test resistance near $1.65–$1.70 in the short term. A pullback toward $1.45–$1.50 remains likely as a healthy retracement before the next leg up. Traders should watch the $1.24 support zone, a break below could signal renewed weakness.
XRP Price & Open Interest (OI) Analysis
The chart shows XRP forming a strong bullish structure since mid-July. Price consolidated near $1.00–$1.15 through early August before a sharp breakout around August 22, jumping to $1.70 within days, a clear signal of aggressive fresh positioning. Open Interest rose in tandem, climbing from roughly $2.3B to nearly $3.8B, confirming that the rally was driven by new capital entering the market rather than short covering alone.
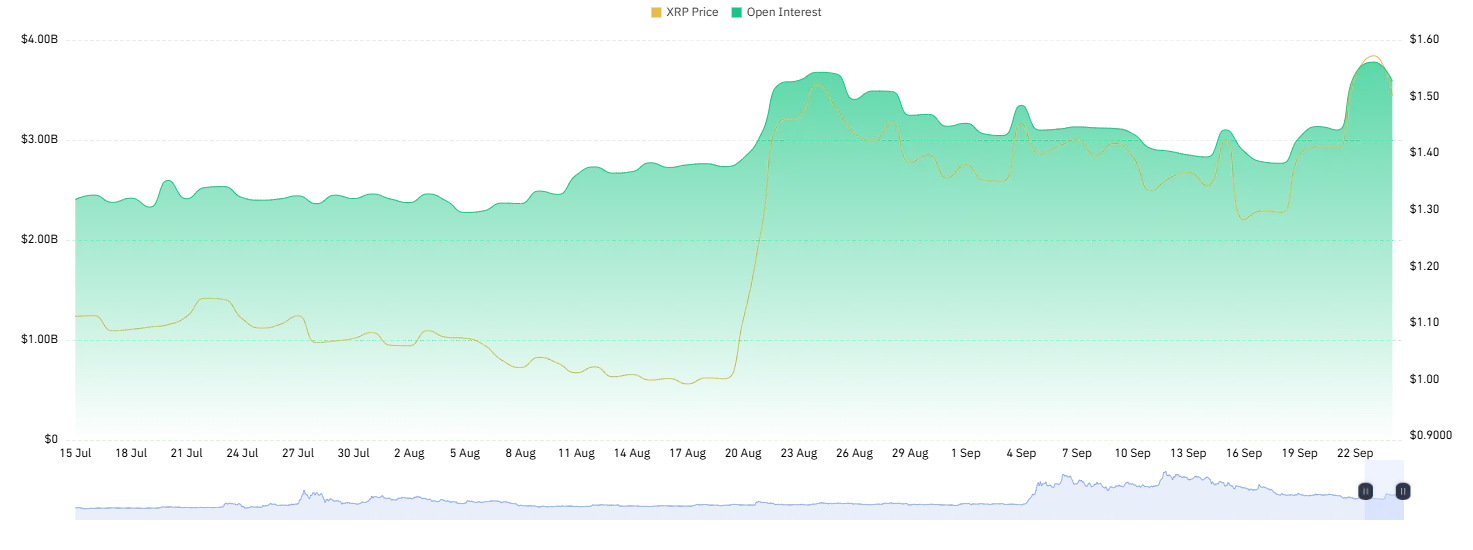
After the breakout, price consolidated in a $1.30–$1.45 range through most of September, with OI staying elevated, a sign traders were holding positions rather than exiting. The dip to $1.24 in mid-September saw OI hold steady, suggesting accumulation. The renewed surge toward $1.55–$1.65 by late September, alongside another OI spike, points to continued bullish momentum.
Overall, rising price alongside rising OI suggests genuine buying interest, favoring further upside if this trend holds though a sharp OI drop could signal a reversal or long liquidation risk.
Final Thought
XRP’s price action reflects a textbook breakout-retest scenario, backed by rising volume and Open Interest, both of which point to fresh capital entering the market rather than short-term speculation. The $1.48 zone is now the line in the sand: a strong close above the previous day’s high on rising volume would strengthen the case for a run toward $1.65–$1.70 in the near term, with $2.2 as the extended target if broader market sentiment (led by BTC) stays supportive.
That said, the sharp intraday pullback is a reminder that volatility remains high, and the retest of the breakout zone hasn’t been decisively won by buyers yet. A slip below $1.48, and more critically below the $1.24 support, would weaken the bullish structure and open room for a deeper correction. As always, traders should track how price behaves at these key levels alongside volume and OI trends rather than reacting to any single day’s move.
What does the XRP breakout and retest pattern mean?
A breakout occurs when XRP price moves above a key resistance level ($1.48 in this case) with strong momentum. A retest happens when the price pulls back to that same level to check if it now holds as support. If buyers defend this zone, it signals strength and often precedes the next leg up.
Can XRP price really rally 40% from current levels?
The 40% target is conditional, not guaranteed. It depends on XRP closing above the previous day’s high on rising volume, along with broader market conditions (especially BTC) staying bullish. If these conditions aren’t met, the rally could stall or reverse instead.
What is the key support level to watch for XRP right now?
The $1.48 zone is the immediate support to watch, as it’s the former resistance-turned-support after the breakout. The more critical level is $1.24, a break below which could weaken the entire bullish structure built since mid-August.