

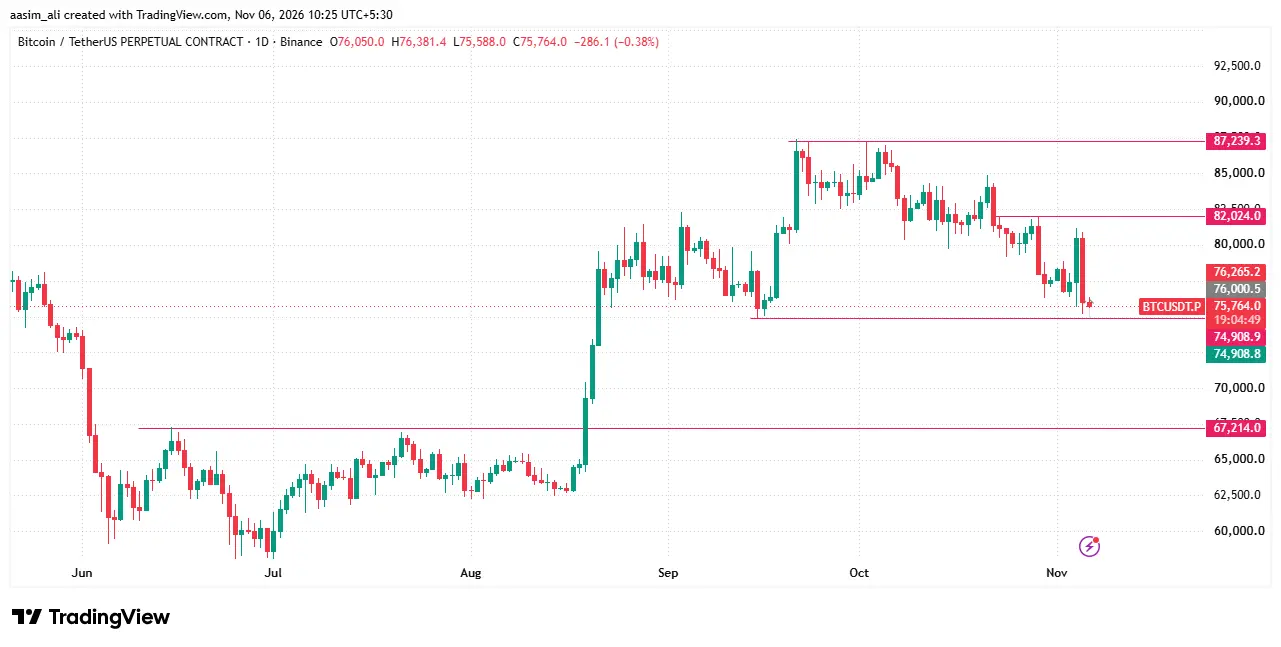
The Bitcoin price experienced sharp selling and has dropped by 5.49% on Thursday’s U.S. trading session. BTC price has dropped below recent lows and nearing the September low. This low could be a crucial support zone because the next support zone is $67,000. There might be a liquidity sweep below the September low of $74,909 and a bullish move can be seen after the sweep.
The Bitcoin price faces strong rejection from higher levels.
Before the fall, Bitcoin price had made a push towards the $81,000 region, which gave buyers some hope that the downtrend since the October highs was ending. That hope did not last. The daily candle turned sharply red, erasing the gains of the earlier sessions and sending the price back towards the lower end of its recent range.
On the larger picture, Bitcoin price has been in a corrective phase since topping out near $87,239 around late September and early October. Since then it has made lower highs, with $82,024 acting as the next key resistance on the way up. The latest drop fits that pattern, and it shows sellers are still active on every bounce.
Why the September low is back in focus
With Bitcoin price now only about 1% above the September low of $74,909, traders are asking whether the market will go below it. Analysts call this a liquidity sweep. Many stop-loss orders sit just under an obvious previous low, and when price dips below it, those orders trigger and release a burst of liquidity.
The possibility of such a sweep is high right now, and the upcoming US elections are seen as the main reason. Political uncertainty tends to make large investors cautious, and crypto often reacts first because it trades around the clock. Until there is more clarity, pressure on prices can continue.
Why a sweep does not have to be bearish
A move below the September low does not automatically mean the trend has turned. Market participants point out that large buy orders are placed around that zone. If price dips into it, those orders could absorb the selling and send Bitcoin price sharply higher again.
This is a common pattern in volatile markets. Price briefly breaks a well-known low, shakes out weak hands and traps late sellers, then reverses because buyers were waiting. In that case, the sweep would turn out to be a fake breakdown instead of the start of a deeper fall.
Volume and open interest will tell the story.
If the sweep does happen, two data points will matter most: trading volume and open interest (OI). Open interest shows the total value of outstanding derivatives contracts and is a good indicator of how much fresh money is entering the market.
If both volume and OI rise during and after the sweep, it would suggest strong participation and conviction from buyers. That combination often comes before a bullish move, because it shows the dip is being bought aggressively and is not just a pause before more selling. A bounce on thin volume, on the other hand, is usually less reliable.
Bitcoin price nearing September low: Can it rebound after sweep?
The chart points to $74,909 as the level that separates the two outcomes.
Source: TradingView BTC/USDT
In the bullish scenario, the Bitcoin price recovers from the current zone and manages to sustain above $74,909. This would mean buyers have taken back control after Thursday’s sell-off and would put the $82,024 resistance back in play. A clean move above that could open the way for a retest of the higher range, with $87,239 as the major level above.
In the bearish scenario, the Bitcoin price fails to reclaim $74,909 and gives a closing below it, with the September low then giving way. A daily close below $74,908 would suggest the sweep has turned into a real breakdown. In that case, the next major support on the chart is near $67,214, which was a strong resistance zone earlier in the year before the August rally.
Traders often say that closes matter more than intraday moves, since a close shows where the market was willing to settle after the volatility. The daily closing relative to these levels will therefore be an important clue in the coming sessions.
Final thoughts
With volatility high and a major political event approaching, risk management matters more than usual. Using stop-losses, avoiding excessive leverage and not chasing sudden moves in either direction can help. Sweeps and fake breakdowns are common around such levels and often catch overconfident traders on the wrong side.
Technical levels are guides, not guarantees. Price can behave differently if big news arrives, and election outcomes can quickly change market mood.
The Bitcoin price now sits at a crossroads. A sweep of the September low followed by a bounce, backed by rising volume and open interest, would be a positive sign, and a sustained move above $74,909 would strengthen that view. A closing below the September low would shift the balance towards the bears. The next few sessions should show which way the market wants to go.
Why did Bitcoin fall 5.49% in a single day?
There was no single trigger. The drop came from a mix of profit booking, cautious positioning and uncertainty around the upcoming US elections. Bitcoin had bounced towards the $81,000 region, but sellers rejected that move sharply, and the price fell back to around $75,764. Leveraged traders were also caught on the wrong side, which added to the speed of the fall.
What is the September low, and why does it matter?
The September low is the lowest price Bitcoin touched in September, near $74,908 on the chart. Traders watch it closely because many stop-loss orders sit just below such levels. Bitcoin is now only about 1% above it, so the market is very close to testing it.
What is a liquidity sweep?
A liquidity sweep happens when price briefly moves below an obvious previous low (or above a previous high) and triggers the stop-loss orders placed there. Large players can use that burst of liquidity to build positions. After the sweep, price often reverses sharply, which is why it is sometimes called a fake breakdown.