

Bitcoin is a leading coin in the cryptocurrency market and ranks 1st as per the market capitalization. The Bitcoin price has experienced selling pressure since October and has dropped below a major support zone. Bitcoin might remain volatile on 10th November as the CPI report is about to drop. Let’s connect these dots and see how BTC can react further.
How can the U.S. CPI report impact Bitcoin price?
CPI (Consumer Price Index) measures US inflation. It affects Bitcoin mostly indirectly, through expectations about interest rates.
The chain of effect
- CPI shows how fast prices are rising in the US.
- That shapes what the Federal Reserve is expected to do with interest rates.
- Interest rates change how much investors want to hold risky assets like Bitcoin.
Hotter than expected (higher inflation)
- The Fed is less likely to cut rates and may even hold them higher for longer.
- Higher rates make safe assets like bonds more attractive and borrowing more expensive.
- Money tends to leave risk assets, so Bitcoin often drops. Leveraged long positions can also get liquidated, which makes the drop sharper.
Cooler than expected (lower inflation)
- Rate cuts look more likely, and liquidity conditions look easier.
- Risk appetite improves, and Bitcoin often rallies.
In line with expectations
- The reaction is usually small, because the market had already priced it in.
What matters is the surprise, not the number. If the market expects 3.0% and the print is 3.0%, there’s little reason for a big move. The gap between the actual number and the forecast is what triggers volatility. Core CPI, which excludes food and energy, often gets as much attention as the headline figure.
Bitcoin price overview
At press time, Bitcoin was trading at $74,822.00 and has remained neutral in an intraday session. Its market capitalization was $1.503T and the 24-hour trading volume was $28.193B. It has a circulating supply of 20.11M BTC, the total supply is 21M BTC, and its current dominance is 60.74%.
Bitcoin price technical analysis over 1-D timeframe
The Bitcoin price has been in a short-term bearish trend since October and has dropped by 10.66%. In early October, BTC tried to exceed the previous high of $87,400, but sellers were strong enough and dominated further.
Amid this bearish trend, the price has dropped below a major support level of $75,000. The weekly candlestick has closed below this level, which showcases the bears’ dominance.
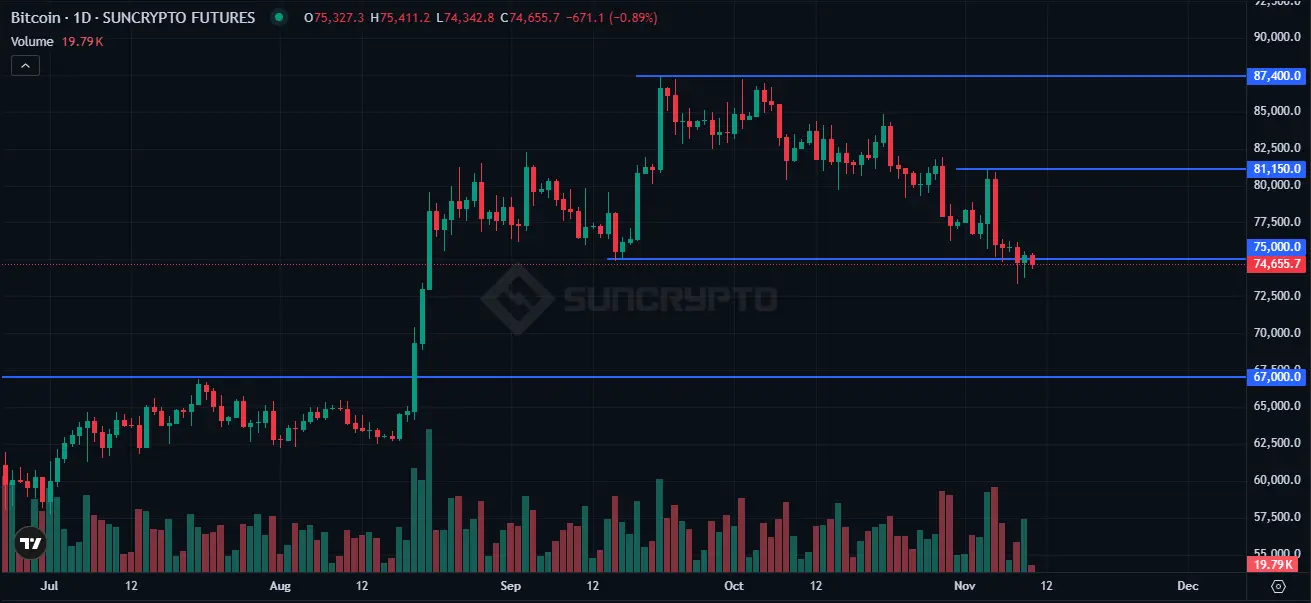
If the price sustains below this level, then the trend could remain bearish for the next few weeks. If the price starts trading below the descending trendline on a daily time frame, then it would be difficult for buyers to rebound.
Conversely, if the Bitcoin price rebounds and starts trading over the support level of $75,000, then buyers might be confident. If buyers dominate, then the BTC price can reach the immediate resistance level of $81,150.00, and the short-term bearish trend can flip to bullish.
Bitcoin price, funding rate and Open Interest analysis
The Bitcoin price is consolidating after a sharp sell-off on November 9 that pushed the price from roughly $75,800 down to the $73,700 zone. That drop was accompanied by a visible fall in aggregated open interest, from about $22.4 billion to a low near $21.6 billion, which points to leveraged longs being flushed out. Open interest has since recovered to around $22.02 billion, suggesting traders are cautiously rebuilding positions.
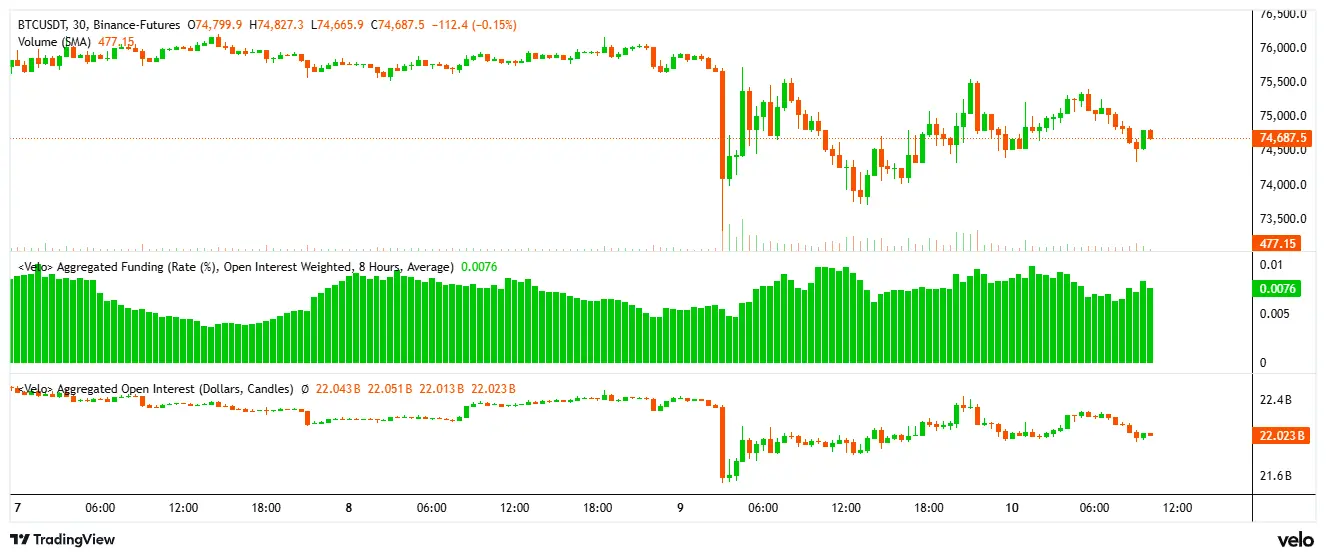
The OI-weighted funding rate sits at 0.0076%, positive but modest, so longs still pay shorts without the crowded-trade excess that often precedes sharper corrections. Price has formed a short-term range, with support near $74,000 and resistance around $75,500 to $76,000. A hold above support could set up another test of $75,500, while a breakdown below $73,700 may trigger further liquidations toward $73,000. Traders should watch whether OI and funding rise together with price, which would confirm genuine strength rather than leverage-driven moves.
Final thought
Bitcoin is trading near $74,800 after slipping below the key $75,000 support, with the weekly candle closing under it, a sign that bears still hold the upper hand. The short-term trend has stayed bearish since October, and the price is down roughly 10.66% in that period. With the US CPI report due on 10th November, volatility is likely, but the real trigger will be the gap between the actual number and market expectations, not the figure itself.
A hotter print could push BTC toward $73,000 if the $73,700 level breaks, while a cooler one may revive risk appetite. Derivatives data shows leveraged longs were flushed out on 9th November, and the modest 0.0076% funding rate suggests the market isn’t overcrowded. For bulls, reclaiming $75,000 and holding it could open the way to $81,150. Until then, traders should stay cautious, watch open interest and funding alongside price, and manage risk carefully around the CPI release.
How can the US CPI report affect Bitcoin price?
CPI measures US inflation and shapes expectations for Federal Reserve interest rate decisions. A hotter-than-expected print can reduce rate-cut hopes and pull money out of risk assets like Bitcoin, while a cooler print can improve risk appetite and support a rally. If the number matches forecasts, the reaction is usually small.
Why did Bitcoin price fall below $75,000?
Bitcoin has been in a short-term bearish trend since October, with sellers defending the $87,400 high and pushing the price down by about 10.66%. The weekly candle closing below $75,000 confirmed the loss of this major support and showed bears are in control.
What are the key support and resistance levels for Bitcoin now?
On the daily chart, $75,000 is the major level to reclaim, with immediate resistance at $81,150. On the shorter-term range, support sits near $74,000 and resistance around $75,500 to $76,000. A breakdown below $73,700 could lead to further liquidations toward $73,000.