

Bedrock price has been in a bullish trend and has reached an all-time high of $0.6784. Bedrock price has been defending the 200-days key moving averages on a daily timeframe for a longer period of time. Amid this bullish rally, trading volume and OI has increased sharply which showcases the involvement of traders and investors.
What is bedrock (BR)?
Bedrock is designed as a “restaking” protocol. In simple terms, this means it allows users to take their staked assets (like ETH or BTC) and “restake” them to earn additional rewards. The key innovation here is that it aims to do this while keeping the assets liquid, so they aren’t locked away and can still be used for other purposes in the DeFi ecosystem.
What makes the BR token itself special?
The BR token is the operational engine of this ecosystem, fulfilling distinct roles:
- Dual-Token Governance (veBR): BR uses a Proof of Staking Liquidity (PoSL) model. Users who lock their BR tokens receive veBR (Vote-Escrowed BR), which gives them rights to vote on protocol upgrades, validator selection, and emission schedules.
- Yield Boosting & Incentives: Holding and locking BR tokens allows users to boost the yields they earn on their liquid staked assets. The token is also used to distribute rewards back to liquidity providers within the ecosystem.
Bedrock price overview
At press time, Bedrock coin was trading at $0.6203 with an intraday gain of 193%. Its market capitalization was $183.982M but its circulating supply is 296.667M BR and the total supply is 1B BR. Bedrock price has been in a bullish trend on a wider timeframe.
BR price analysis over 1-D timeframe
Bedrock price has been in a bullish trend and has surged by 326% since August. Since April 2026, the price has been holding over the 200-days EMA on a daily timeframe which showcases the bulls’ domination. Amid this bullish trend Bedrock coin price has recorded an all-time high of $0.6784 on 17 September 2026.
The chart structure displays that the price has made closing over the previous candle on a daily timeframe. This strong closing suggests that buyers are strong enough and have the potential to continue the trend. Amid this rally, trading volume has increased sharply which could work as a catalyst in further rally.
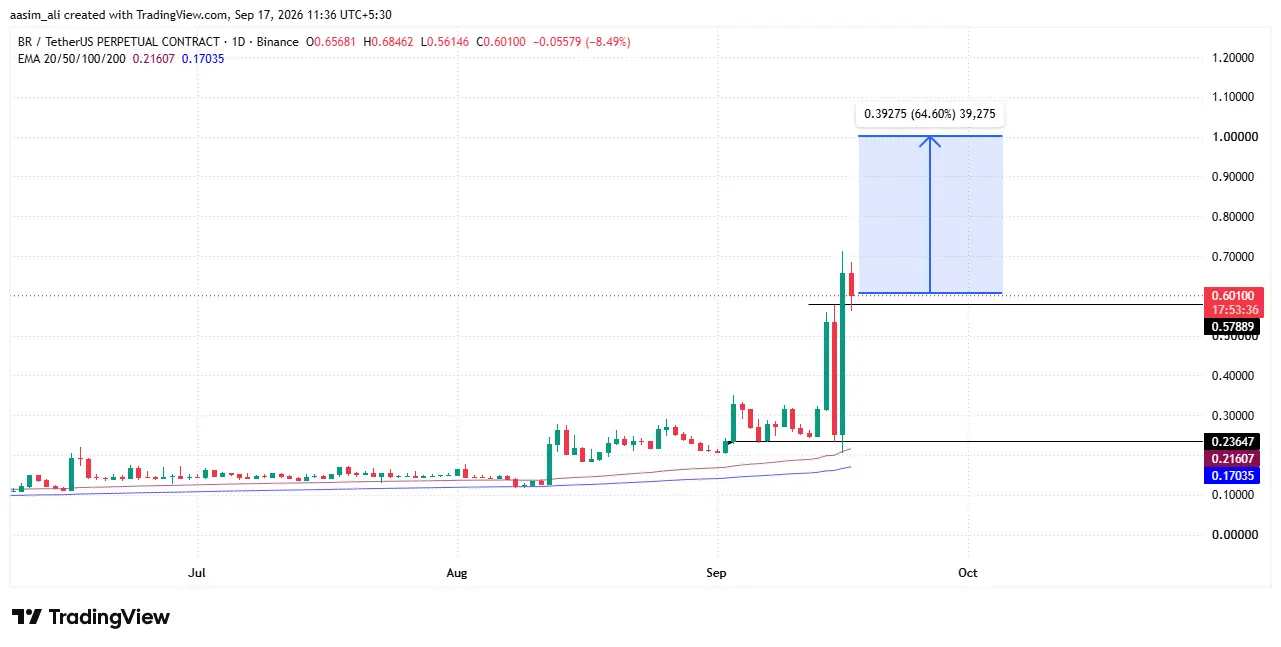
If BR price holds over the previous day (16th Sept.) candle high, buyers might dominate further. If the price holds over the $0.5788 level, buyers might lead the trend further. If the trading volume and OI keep supporting this momentum, BR price may extend to the $1 mark in a few weeks.
Conversely, if the Bedrock price slips below the $0.5788 level then buyers might panic. Here, profit booking can be seen which may lead to sharp selling.
Bedrock price and open interest (OI) analysis
BR has moved through five phases since 17 Aug, with price and Open Interest (OI) tracking closely, a sign the rally is leverage-driven. After weeks of consolidation near $0.19–$0.27 (OI $20-25M), two breakout attempts in early and mid-September pushed price to $0.23-$0.33 before retracing each time. The real move came 14-17 Sep: price rocketed from $0.20 to a peak near $0.70, while OI exploded from $32M to over $100M, one of the fastest OI build-ups in the dataset, still climbing as data ends.
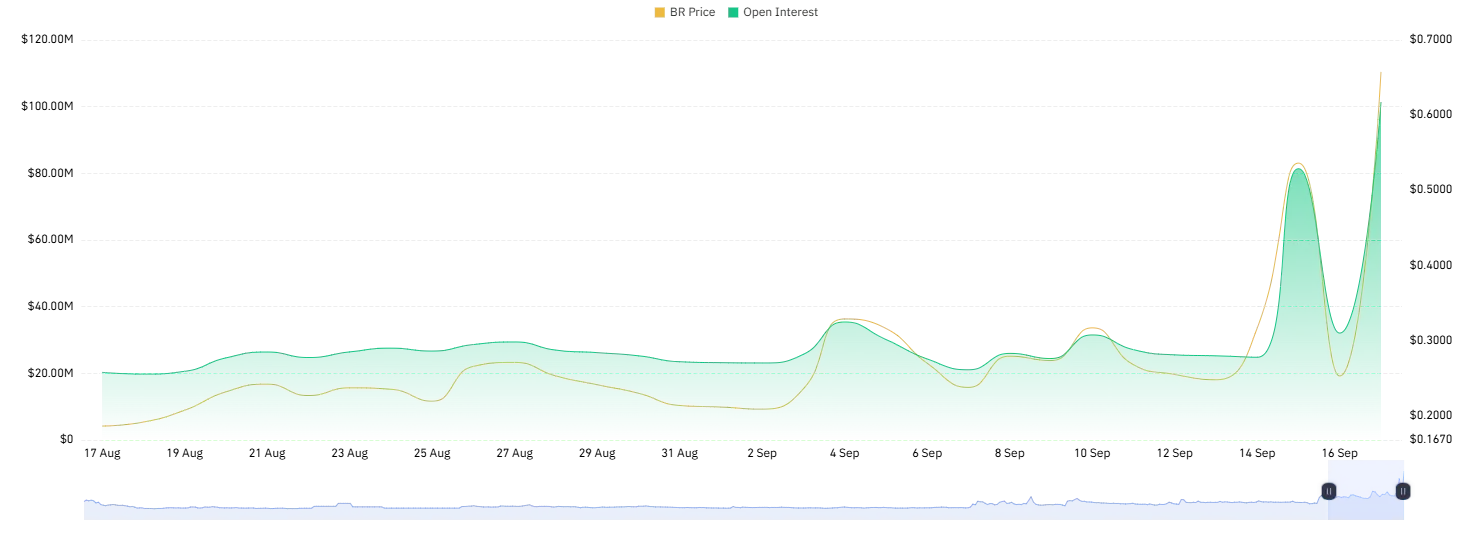
This pace of leverage inflow raises long-squeeze risk. Based on the pattern of prior pullbacks (25-35% after each leg), two scenarios stand out: continuation toward $0.70-$0.75 if OI keeps building and price holds above $0.45-$0.50, or a correction to $0.35-$0.40 if momentum stalls. Given the leverage involved, a volatile cooldown looks more likely than a straight-line move up.
Bedrock price and volume analysis
The BR price and volume chart from 17 August to 16 September shows a clear accumulation-to-breakout pattern. For nearly three weeks, price stayed range-bound between $0.185 and $0.330, with only a minor spike to $0.30 around August 27, while trading volume remained thin, mostly under $50M daily. A short-lived volume surge to $150M on September 4 lifted price to a local high of $0.32, before it cooled back down to the $0.20–$0.28 zone through mid-September.
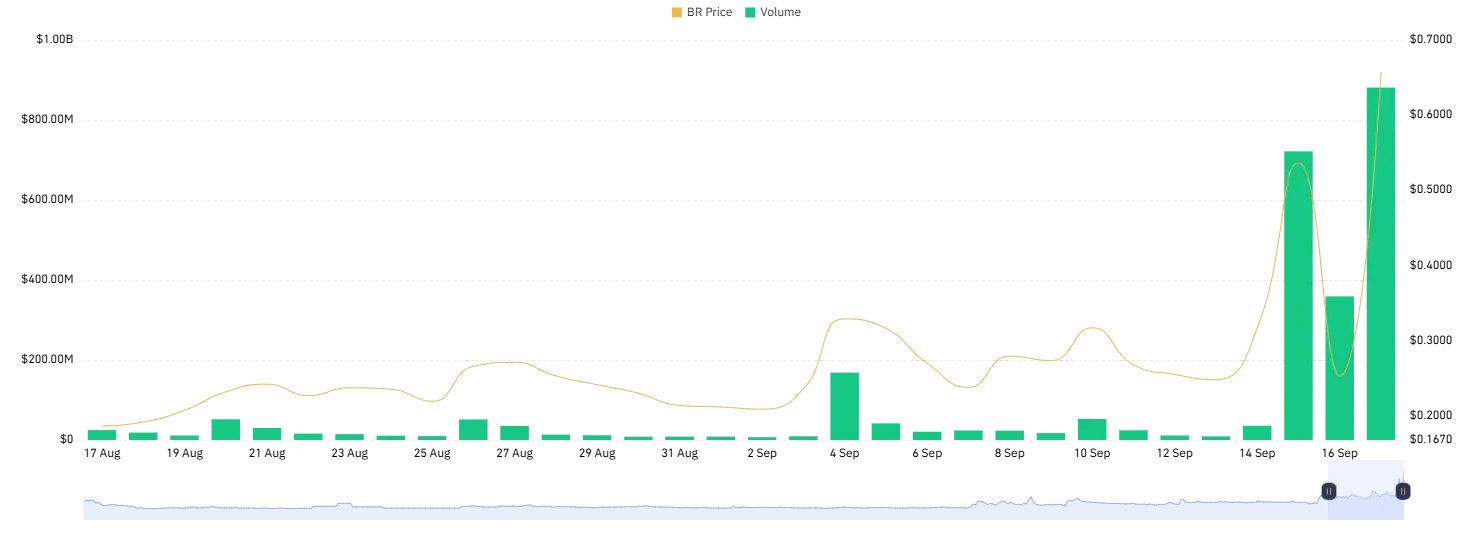
The real momentum arrived in the final days, as volume exploded to $700M on September 15 and crossed $850M on September 17, driving the price sharply higher to the $0.50–$0.65 range. This kind of low-volume consolidation followed by a sudden volume-driven breakout typically signals strong incoming buyer interest. If volume holds above $500M, Bedrock price could push toward $0.70–$0.80 next; a drop in volume, however, may trigger a pullback toward the $0.40–$0.45 support zone.
Final thought
Bedrock’s 160%+ surge in September has been backed by genuine volume and OI expansion rather than thin, low-liquidity movement, which lends some credibility to the breakout. That said, the speed of leverage building up alongside price is a double-edged sword: it can fuel a run toward $1, but it also raises the odds of a sharp long-squeeze if momentum pauses even briefly.
For now, $0.5788 remains the level to watch on the downside, while sustained volume above $500M and OI continuing to build are the key conditions for an extension toward $0.70-$0.80 and eventually the $1 mark. Traders should treat this as a high-volatility setup, size positions accordingly, and watch for signs of exhaustion (fading volume, OI plateauing, or a failure to close above prior day’s highs) that could signal a 25-35% pullback in line with Bedrock’s prior corrective legs.
Why has BR price surged so much in September?
The rally is backed by a sharp jump in trading volume, which crossed $850M on September 17, along with Open Interest exploding from $32M to over $100M in just a few days. This combination signals genuine buyer interest along with heavy leveraged participation.
What is the key support level to watch for BR?
$0.5788 is the critical level. As long as BR price holds above this, buyers are likely to remain in control. A slip below it could trigger profit booking and sharp selling.
Can BR price reach $1?
It’s possible if trading volume stays above $500M and Open Interest keeps building. In that case, BR could extend toward $0.70–$0.80 first, with $1 being the next milestone. However, given the leverage-driven nature of the rally, a 25-35% correction remains a real possibility if momentum fades.