

Velvet price has experienced sharp selling and has dropped by 76% on Monday (24th August). Amid this bearish trend, the VELVET price has slipped below the key moving averages. However, the price is still defending a support level of $0.0900 from where the bullish rally was begun in June. Let’s explore what could be the possible outcome for Velvet coin price behavior.
Velvet (VELVET) price overview
Velvet price was trading at $0.1463 at press time with an intraday loss of 70%. Its market capitalization is $68.734M and the 24-hour trading volume is $56.884M. It has a circulating supply of 463.818M VELVET and the total supply is 1B VELVET.
VELVET price analysis over daily timeframe
The chart structure of Velvet coin displays that the price has crashed by 76% in a day. Amid this fall, the price has slipped below few support levels and is trading below the 100-days and 200-days exponential moving averages (EMA). This data shows complete bears’ domination.
Furthermore, the asset price was heading toward the major support level of $0.0900. This was the level from where the previous bull run was started, so this could be an important level to watch.
Suppose the price drops to the $0.0900 level and forms any bullish candlestick pattern, buyers might be attracted. Here, trading volume can play an important role in the trend reversal. If the price bounces back and surpasses the 200-days EMA then the recent bearish trend can be flipped to bullish.
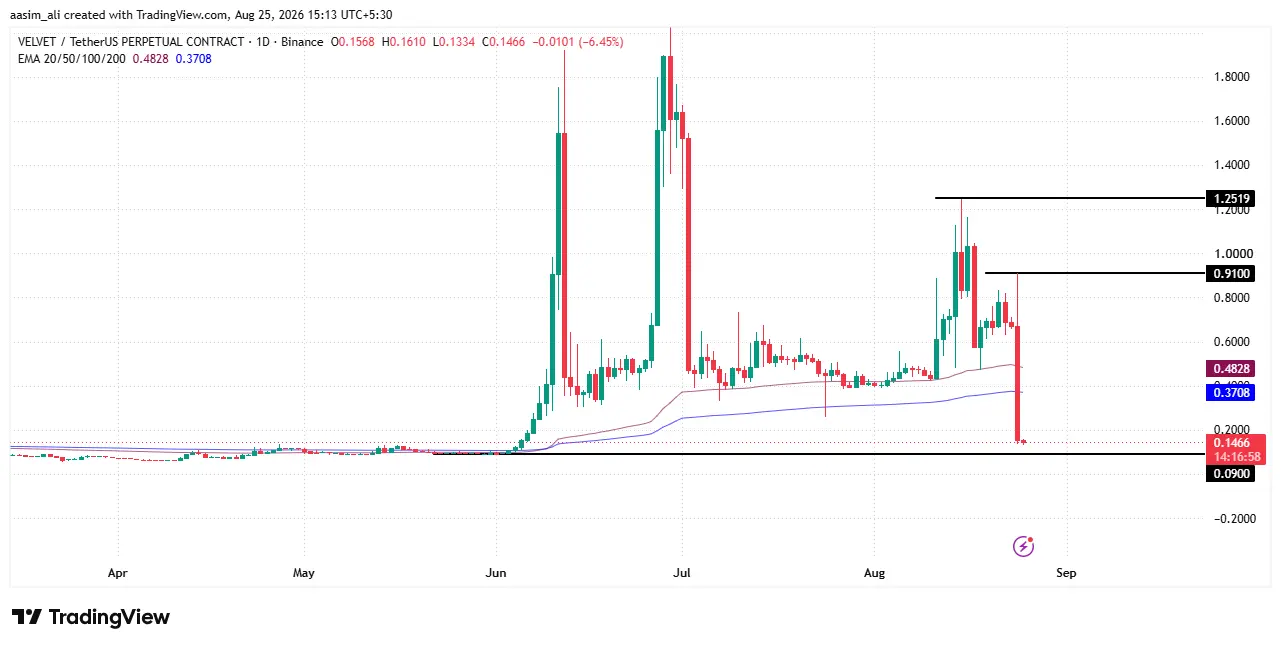
On the other hand, if sellers remain stronger then the VELVET price can drop to the $0.0900 level. If buyers fail to defend this level and the price starts trading below this level, it could be difficult for buyers to bounce back. Suppose the price sustains below the $0.0900 level, the VELVET coin price may record a new all-time low.
VELVET Price vs Open Interest
Open Interest (green) and price (yellow) moved almost in lockstep during two sharp spikes, mid-June ($150M OI, price near $1.50) and late June-early July ($240M OI, price peaking above $1.80-2.00). This shows leveraged/futures positioning was directly driving price momentum: as traders piled into long positions, OI surged and pushed price up; when OI unwound (positions closed/liquidated), price crashed just as fast. Both spikes show classic pump-and-dump leverage behavior rather than organic spot demand.
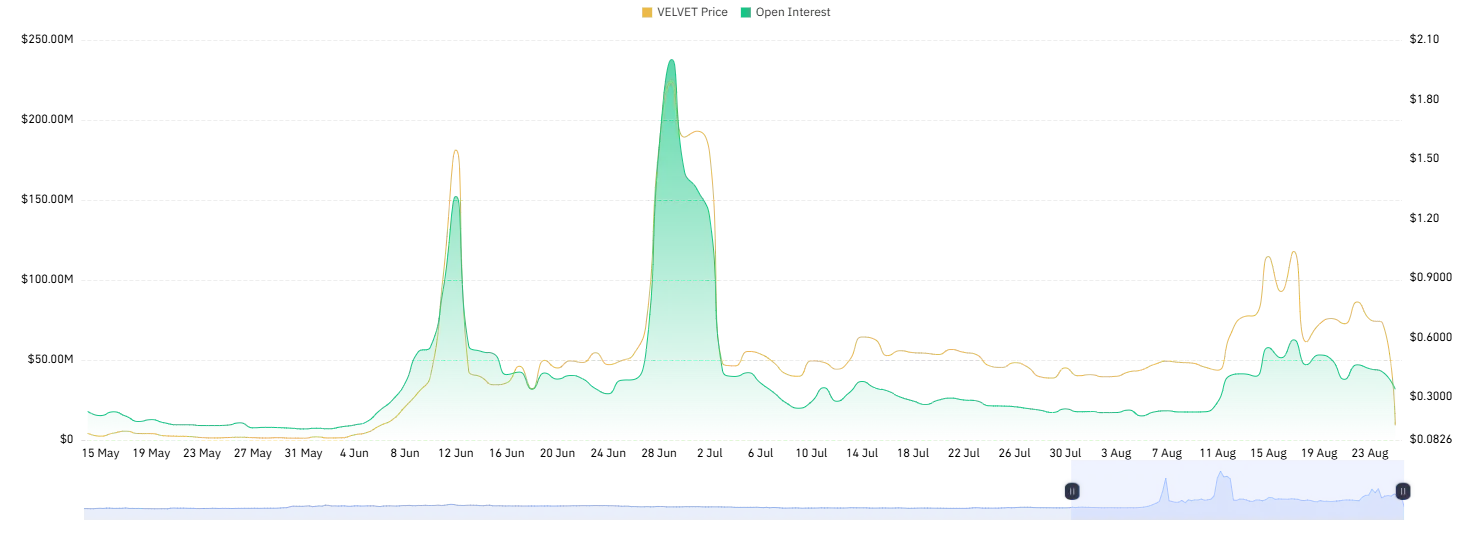
From mid-July to early August, both metrics stayed flat and low, indicating consolidation with little speculative interest.
From 03 Aug onward, price climbed again (to $0.90) but OI rose only modestly compared to the June/July spikes, suggesting this rally has more genuine buying support and less leverage-driven risk. However, the sharp OI and price drop near 23 Aug signals another possible unwind, so downside volatility risk remains if leveraged positions get liquidated again.
Velvet price vs volume analysis
VELVET has shown three distinct volume spikes since mid-May. The first and largest occurred around June 11–13, with volume touching nearly $2.3B alongside a sharp price rally to roughly $1.90-2.00, marking the token’s strongest breakout. A second spike followed on June 28–30, pushing volume above $1.7B as price climbed back toward $1.80. After this, volume steadily declined through July, coinciding with a prolonged price correction down to the $0.30–0.40 range.
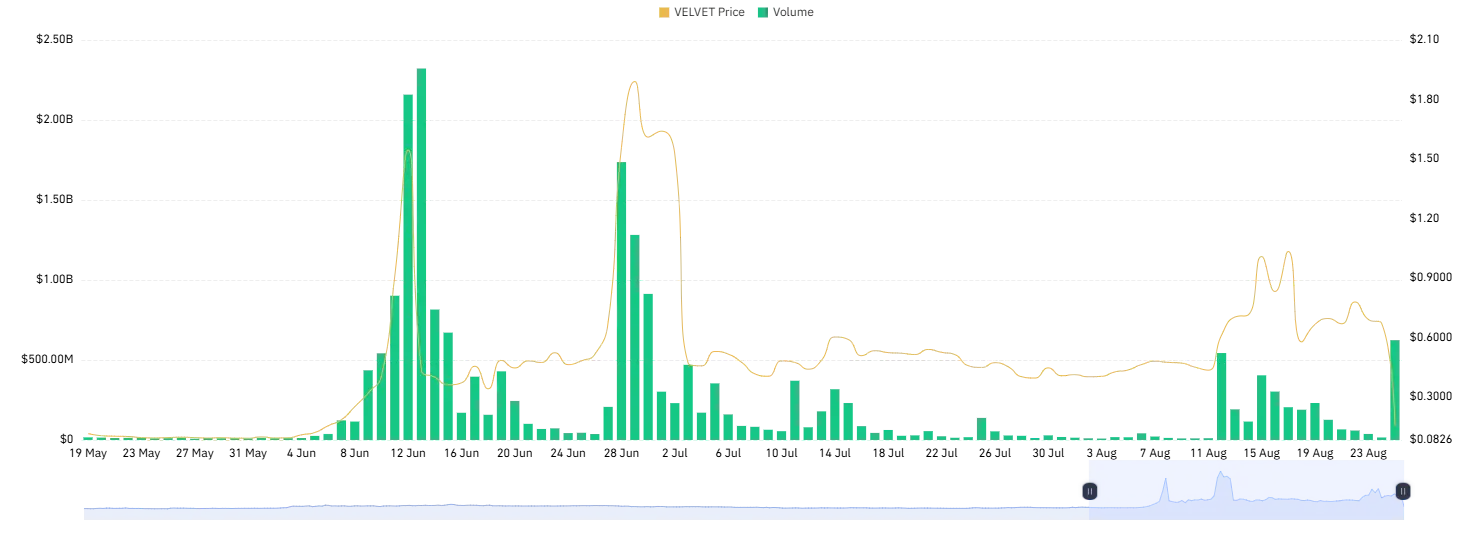
A third, smaller volume surge appeared around August 11–15 ($400–500M), lifting price briefly toward $0.90 before fading again. By late August, volume and price have both cooled significantly, with price settling near $0.08.
Final thought
VELVET’s 76% single-day crash has wiped out most of the gains built since the June rally, leaving the token hanging just above its critical $0.0900 support, the same level that sparked the original bull run. The open interest and volume data both point to the same story: this token’s price action has been heavily leverage-driven, with sharp OI unwinds coinciding almost exactly with the steepest price drops. That’s a pattern of speculative positioning rather than sustained spot demand, which makes the coming sessions especially important to watch.
For bulls, the path back requires two things happening together: price holding the $0.0900 zone and volume picking back up on any bounce. A reclaim of the 200-day EMA on strong volume would be the clearest signal that sentiment is genuinely shifting, not just a dead-cat bounce. Without that volume confirmation, any recovery attempt risks fading quickly, as seen in the August 11–15 spike that lifted price toward $0.90 before collapsing again.
For bears, the setup is simpler, a break and daily close below $0.0900 opens the door to price discovery on the downside, potentially pushing VELVET into new all-time-low territory. Given how thin genuine spot demand has looked since mid-July, that scenario can’t be ruled out.
Why did the VELVET price crash 76% in a day?
VELVET saw a sharp sell-off on August 24, breaking below key moving averages including the 100-day and 200-day EMAs. The crash coincided with a sharp drop in open interest, suggesting a large unwind of leveraged positions rather than organic selling pressure.
What is the key support level to watch for VELVET?
The $0.0900 level is the most critical support to track. This was the zone from which VELVET’s previous bull run began in June, making it a significant technical and psychological level for buyers to defend.
Can VELVET price recover after this crash?
A recovery is possible if buyers defend the $0.0900 support with a bullish candlestick pattern backed by strong volume. A reclaim of the 200-day EMA on rising volume would be the clearest signal of a genuine trend reversal rather than a short-lived bounce.