

Solana price has witnessed a mild fall after a bullish rally. The price has surged by around 30% in a month and breached the psychological level of $100. However, it has failed to hold the price above this level. SOL price has surpassed the key moving averages during this bullish momentum which indicated that the overall trend is bullish. Trading volume and OI have also shown changes. Let’s decode these data.
Things to know about Solana Coin
Solana is a high-performance Layer 1 blockchain designed to solve the classic trade-off between speed, security, and decentralisation. Launched in 2020, it uses a unique mechanism called Proof of History, which works like a built-in cryptographic clock that helps validators agree on transaction order quickly, cutting down the delays common on older networks. Combined with Proof of Stake for security, this allows Solana to process thousands of transactions per second at a fraction of a cent per transaction.
Unlike blockchains that depend on Layer 2 rollups for scaling, Solana takes a monolithic approach, keeping all activity on a single chain. This makes it a preferred choice for decentralised finance (DeFi), NFTs, gaming, payments, and other high-frequency applications. Its native token, SOL, is used to pay network fees and is staked by validators to secure the blockchain, making it central to how the entire ecosystem functions.
Solana (SOL) price overview
At press time, Solana coin was trading at $97.18 with an intraday loss of 3.7%. Its market capitalization was $56.981B and the 24-hour trading volume was $3.949B. Its circulating supply is 587.065M SOL and the total supply is 634.111M SOL. Solana price was in a correction phase and has dipped below the $100 level.
Solana price analysis over 1-D timeframe
Since mid of August, Solana price has experienced strong buying pressure and has surged by more than 30% in a month. Amid this bullish rally, the SOL price has surpassed the 200-days EMA on a daily timeframe. This bullish trend was halted near the $110 territory. Since then, the price started a correction on a daily timeframe.
Solana price has made a closing below the previous support level of $97.20 on a daily timeframe. This closing might be a bearish signal and might spread fear among buyers. If the next day’s candle stays below this level, sellers may dominate ahead and a bearish trend can be anticipated.
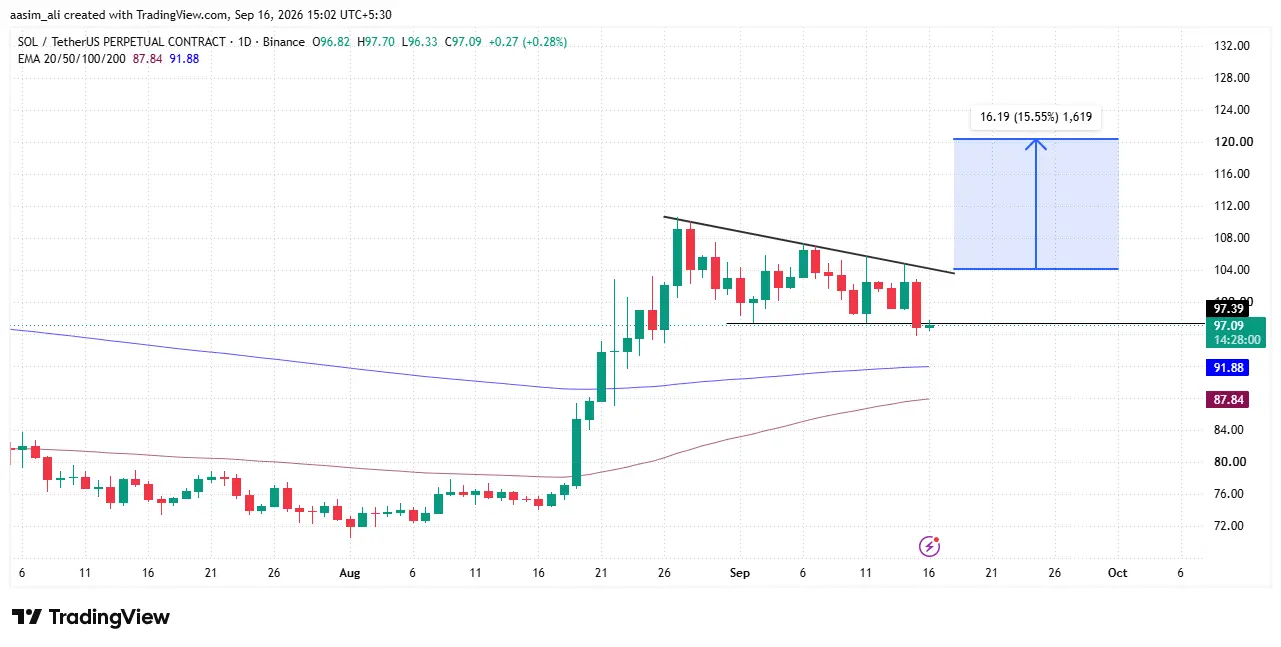
If sellers remain stronger, Solana price may melt to the 200-days EMA on a daily timeframe which is currently staying at $91.88 level. Once the price loses the 200-days EMA, it may drop to the other support level of $84.
Conversely, if bulls start buying and the price exceeds the $104 level then buyers might be confident. Here, increasing OI and volume can work as a catalyst. If these data follow the price momentum, the SOL price could extend to the $120 mark.
Solana price and volume analysis
Solana traded in the $70 to $76 range through early-to-mid August on subdued volume ($4.31B to $5.78B daily), before a decisive breakout: volume surged past $4.92B on 19 Aug and peaked near $16.94B on 28 Aug, coinciding with SOL’s price climbing from $75 to over $110. This volume-price alignment signals strong buying conviction rather than a speculative spike.
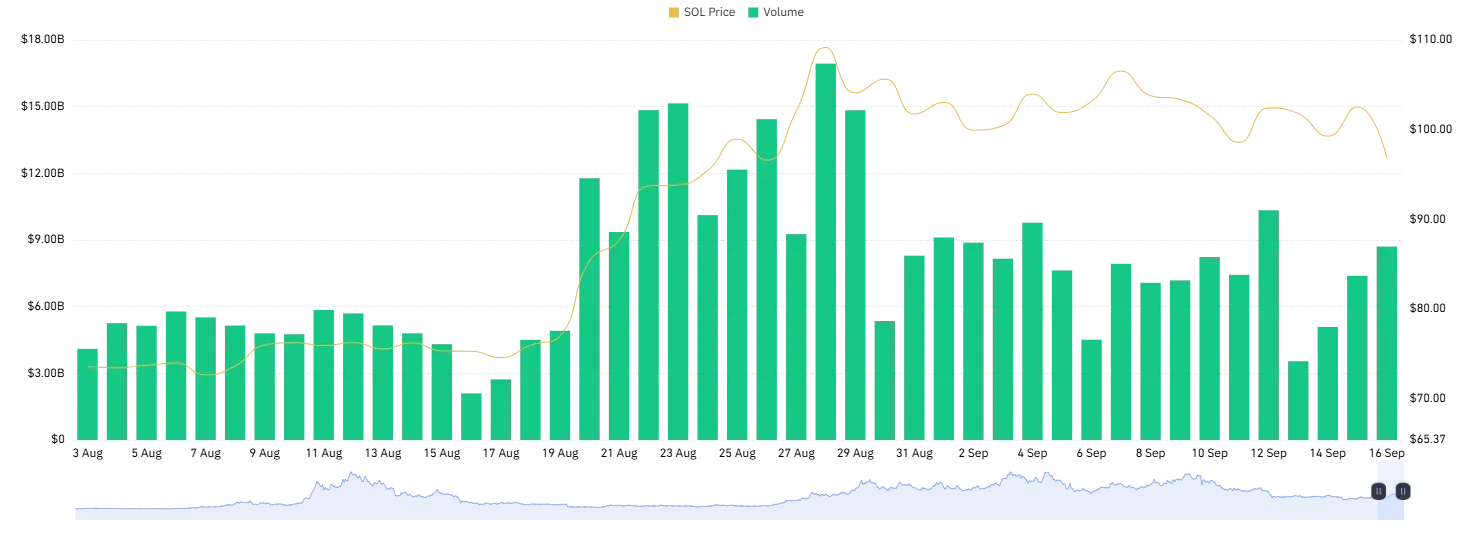
Since early September, SOL has consolidated between $95–$107, with volume cooling to a steadier $6–$9B range: typical of a market digesting gains before its next directional move. The late-August volume spike acted as a key inflection point, flipping momentum bullish.
For price prediction: sustained volume above $8B alongside price holding above the $95 support level would favor a continuation toward $110–$115. A drop below $90 on rising volume, however, would signal weakening momentum and a possible pullback toward $80.
Solana price and open interest (OI) analysis
Solana price fell nearly 5.55% from its September 15 high of $102.83 to a low of $95.72 within 24 hours, marking one of its steepest drops this week. Notably, aggregated open interest declined alongside price: from $2.8B to $2.634B, signaling a long-liquidation event rather than fresh short positioning. This pattern typically indicates leveraged longs being flushed out, often a precursor to short-term stabilization.
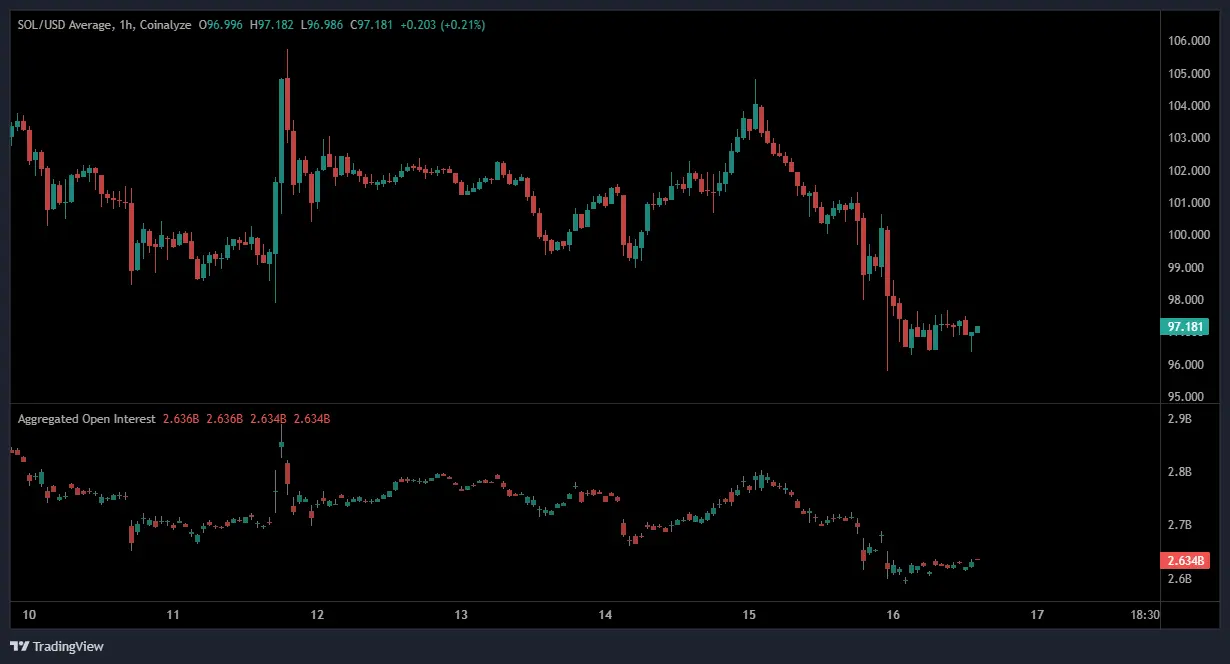
Price is currently consolidating around $97, with $96 acting as immediate support.
Bullish scenario: A hold above $96–$97 with flat OI could open a bounce toward $100–$102.
Bearish scenario: A break below $96 with rising OI would suggest fresh shorts, exposing $94–$95.
Range scenario: Continued sideways action between $96–$100 as the market awaits a fresh catalyst.
Final Thoughts
Solana price is at a critical juncture near $97, having cooled off after a strong 30%+ rally that pushed it past $110. The recent pullback, paired with falling open interest, points to leveraged longs being flushed out rather than a bearish reversal, often a healthy reset before stabilization.
Holding above the $95-$96 support zone with steady volume ($6-$9B range) keeps the bullish structure intact, with $104-110 as the next upside targets and $120 achievable if volume and OI confirm momentum. However, a break below $90-$96 with rising OI would signal fresh shorts, risking a slide toward $80-84. Watch volume closely for direction.
Why is Solana’s price falling right now?
Solana price closed below its $97.20 support level on the daily chart, triggering a correction after a strong 30%+ rally in August. Falling open interest alongside the price drop suggests this is largely a long-liquidation event, where leveraged bullish positions are being flushed out.
What is the key support level to watch for SOL?
The $95-96 zone is the immediate support. Below that, the 200-day EMA at $91.88 is the next critical level, followed by $84 if selling pressure intensifies.
Can Solana rally to $120?
Yes, if bulls push Solana price above $104 and this is backed by rising open interest and sustained volume above $8B. That combination could extend the rally toward $110-115, with $120 as the next major target.