

Polkadot price is standing at a crossroads after 22% move in a week. The bulls seem to be interested after a bearish trend and pushed the price to a breakout territory. Now, buyers are pressing hard, RSI is flashing bullish divergence, and trading volume has more than doubled. Let’s explore the possible outcomes for the Polkadot coin price movement.
Polkadot (DOT) price overview
At press time, Polkadot price was trading at $0.8959 with an intraday loss of 1.2%. Its market capitalization is $1.522B and the 24-hour trading volume is $116.348M. It has a circulating and total supply of 1.7B DOT while the maximum supply is 2.1B DOT.
DOT price prediction: Can trend flip to bullish after breakout?
Polkadot price has been in a bearish trend on a daily timeframe and has dropped by 98.4% from all-time high. Since March, the price has been falling by facing resistance from a descending trendline on a daily timeframe. Amid this fall, buyers have bounced back and have pushed the price to the 100-days EMA and the descending trendline. The price is currently trading near the trendline and a breakout is anticipated.
If the DOT price triggers a breakout from the trendline, buyers might be attracted. If the trading volume increases during the breakout, a decent bullish trend can be expected. Polkadot price could reach the 200-days EMA in the first attempt if buyers remain strong. Here, trading volume can fuel the momentum and can help to lift the price to the $2 mark.
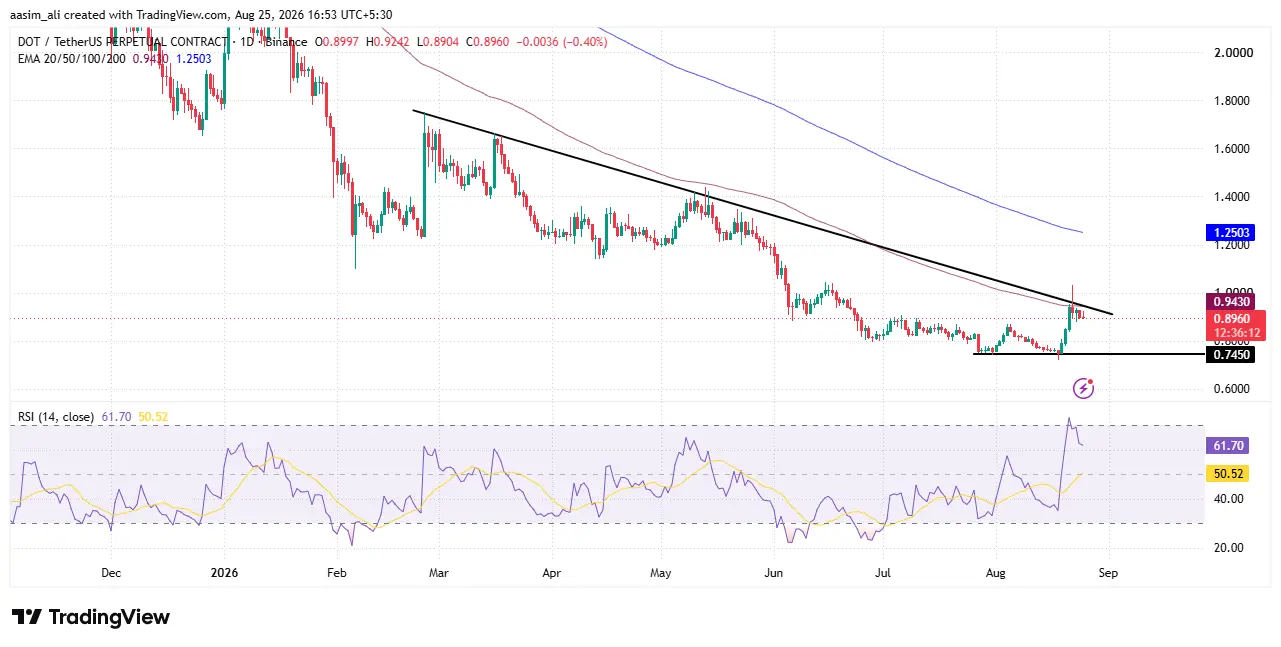
Conversely, if the Polkadot price price fails to exceed the trendline and forms any bearish candlestick pattern then sellers might lead the trend. Suppose the price slips below the immediate support level of $0.7450, the price may continue falling for the next few weeks.
When it comes to the technical indicators, RSI has formed a bullish divergence on a daily timeframe. The trading volume has also increased by more than 100% which shows the engagement of traders and investors. Overall, the technical indicators are in favor of a bullish forecast.
Polkadot perpetual liquidations
The chart tracks Polkadot perpetual futures liquidations from July 21 to August 24, plotting long liquidations (green), short liquidations (red) against the daily DOT price (yellow line, right axis).
The most striking spike was on July 27, when long liquidations touched roughly $2.06M as DOT price cooled off from its late-July highs, wiping out over-leveraged bullish bets. A smaller but notable short-liquidation cluster appeared around August 2, worth nearly $0.6M, as price bounced back and squeezed traders betting on further downside.
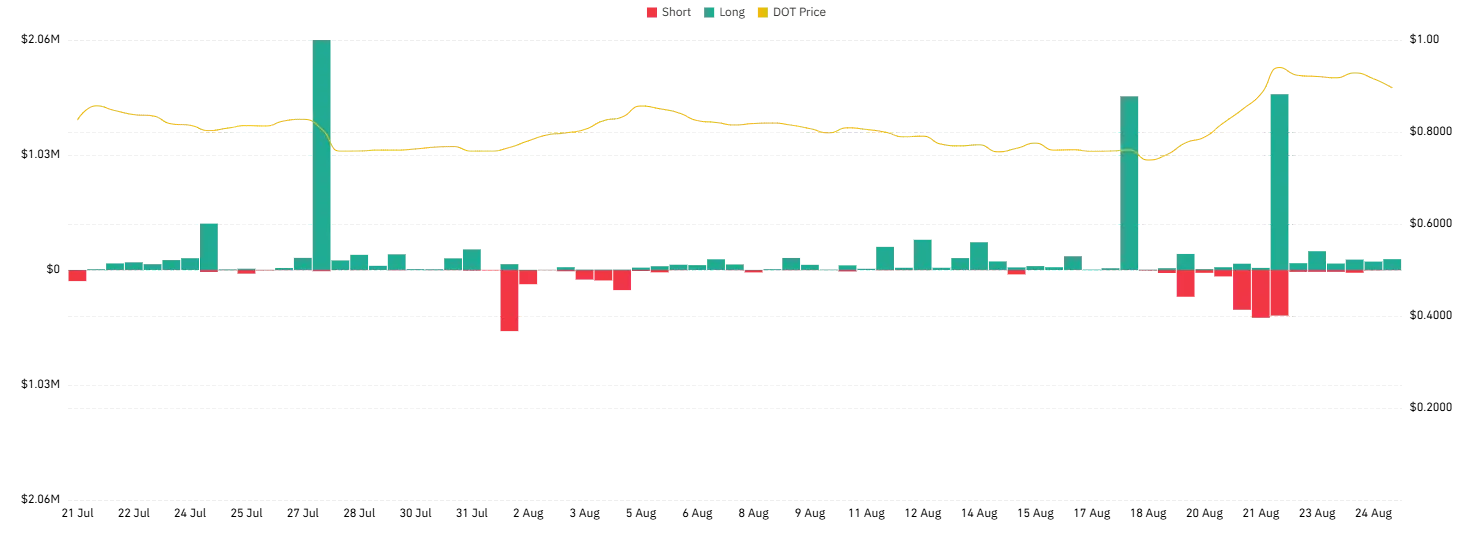
The real action picks up from August 18 onward: two large long-liquidation bars (around $1.2–1.5M each) on August 18 and 22 coincide with DOT’s sharp rally from $0.75 to near $0.97, alongside a heavy red cluster between August 21–22 showing short sellers getting squeezed hard as price surged.
This pattern: repeated long and short liquidation spikes around key price moves, signals high leverage and volatility in DOT’s derivatives market, a factor worth flagging in any near-term price prediction.
Polkadot OI-Weighted Funding Rate Analysis
Polkadot price chart from mid-April to late August shows a clear downtrend, sliding from around $1.40 to a low near $0.80 before a modest recovery toward $0.90–$1.00 in the final week. Despite this bearish price action, the OI-weighted funding rate stayed predominantly positive (green) for most of the period, indicating that long positions consistently outweighed shorts and traders kept paying a premium to stay long even as spot prices fell, a classic sign of persistent bullish sentiment or over-leveraged longs during a downtrend.
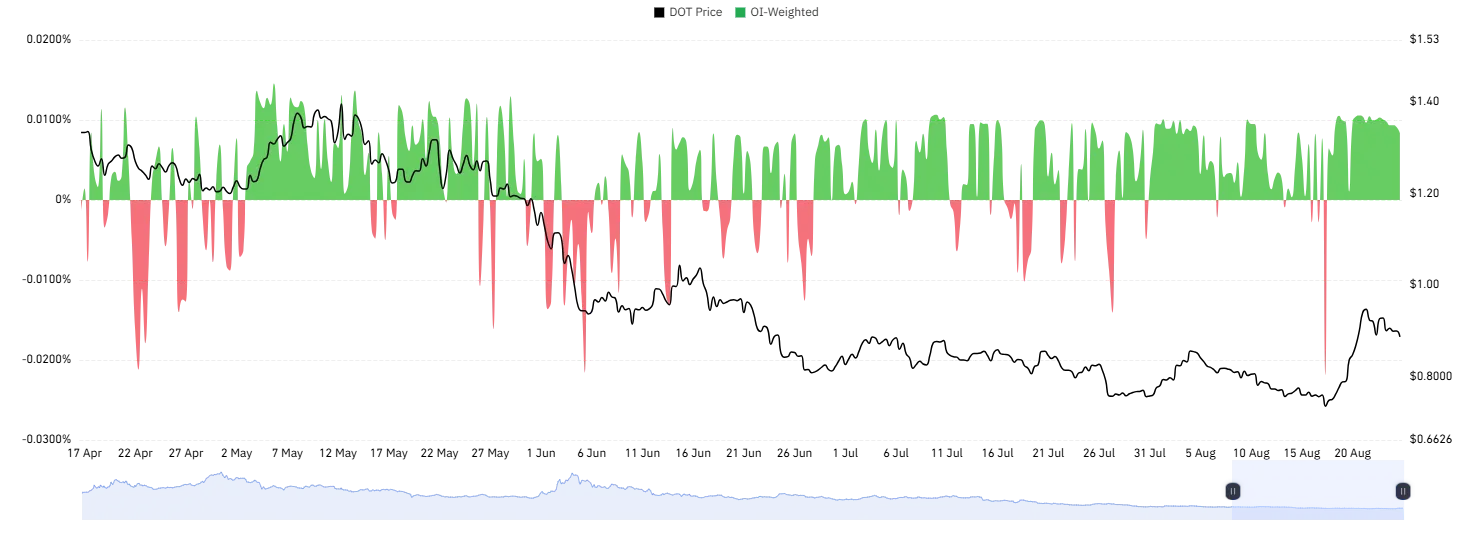
Periodic negative funding spikes (red) appear around late April, early June, and notably mid-August, each coinciding with sharp price dips, suggesting short-term capitulation or aggressive short positioning during local bottoms. The sharpest negative funding spike near August 15–20 lines up directly with the price trough, just before DOT staged its rebound, a pattern often associated with a short squeeze or sentiment reset preceding a reversal.
Final thoughts
Polkadot’s setup right now is a classic breakout-or-breakdown scenario. The confluence of factors, price testing the descending trendline, RSI bullish divergence, and a volume surge does tilt the near-term bias toward buyers. If DOT clears the trendline with strong volume backing, a move toward the 200-day EMA looks achievable first, and a push toward $2 becomes a realistic (though not guaranteed) medium-term target if that momentum holds.
That said, the liquidations data is a reminder that this rally is happening on the back of heavy leverage. Both the July 27 long squeeze and the August 18–22 short squeeze show that DOT’s recent moves have been amplified by derivatives positioning rather than pure spot demand. That makes the breakout more fragile than it might look on the price chart alone, a failed breakout could trigger cascading long liquidations just as fast as it fueled the rally.
For now, the $0.7450 support and the descending trendline resistance are the two levels that matter most. A clean break and hold above the trendline with sustained volume would strengthen the bullish case; a rejection here, especially with a bearish candle close, would put the recent gains at risk and open the door back toward the $0.75 zone.
What does the RSI bullish divergence mean for DOT?
A bullish divergence forms when the price makes a lower low but the RSI makes a higher low, signaling weakening bearish momentum. On the daily chart, this pattern suggests sellers are losing strength and buyers could be preparing to take control.
What price level would confirm a DOT breakout?
DOT needs to close decisively above the descending trendline it has respected since March, ideally with strong accompanying volume. A confirmed breakout would open the path toward the 200-day EMA as the first target.
Can Polkadot realistically reach $2?
Reaching $2 is possible but depends on sustained bullish momentum after the initial breakout. If volume stays strong and DOT clears the 200-day EMA, a rally toward $2 becomes a realistic medium-term scenario, though not guaranteed given DOT’s history of sharp pullbacks.