

Pendle price has remained bullish for a month and witnessed 85% up move. Amid the beginning of this bullish trend, the price has surpassed the 200-days moving average. The funding rate was negative but has suddenly turned positive and trading volume has also increased. PENDLE price has triggered a pullback after a strong bullish trend. Let’s connect the dots.
Fundamentals we should know about Pendle
- What is Pendle?
Pendle is a decentralized finance (DeFi) protocol that allows users to tokenize and trade future yield. It splits yield-bearing assets into two components, Principal Tokens (PT) and Yield Tokens (YT), enabling users to lock in fixed yields, speculate on future interest rates, or hedge against yield volatility. Built on Ethereum and expanded to multiple chains, Pendle has positioned itself as a key player in the “yield tokenization” niche within DeFi.
- TVL (Total Value Locked) and Adoption Metrics
This is a major fundamental driver often missing from pure price-action pieces. If Pendle’s TVL has grown alongside price, that’s a strong bullish fundamental signal worth flagging.
Beyond price action, Pendle’s Total Value Locked (TVL) offers a fundamental gauge of platform adoption. A rising TVL suggests more capital is flowing into Pendle’s yield markets, reinforcing the bullish price structure with real usage rather than speculation alone.
- Token Utility and Tokenomics
PENDLE is the protocol’s native governance and utility token. Holders can lock PENDLE as vePENDLE to gain boosted yields, voting power over incentive allocation, and a share of protocol fees. This vote-escrow model incentivizes long-term holding, which can reduce circulating supply pressure during bullish phases, a factor that may be contributing to the current price rally alongside the technical setup.
- Recent Catalysts or Ecosystem News
If there’s been any recent integration, partnership, or narrative tailwind (e.g., real-world asset (RWA) yields, new chain integration, protocol upgrade), add a short paragraph naming it.
- Sector Comparison / Market Positioning
Pendle operates within the broader “RWA and yield-trading” narrative that has gained traction in 2025–2026, as more DeFi capital rotates toward fixed-income-like products. Its performance can also be viewed in the context of how this niche is performing relative to the broader altcoin market.
Pendle price overview
Pendle coin was trading at $2.27 at press time with an intraday gain of 2.6%. Its market capitalization was $394.555M and the 24-hour trading volume was $67.668M. Its circulating supply is 173.571M PENDLE and the total supply is 281.527M PENDLE.
Pendle Price Analysis Over Daily Timeframe
PENDLE price has been in a bullish trend and has triggered a pullback on a daily timeframe. During this pullback, the price has surpassed the recent high and made closing over daily timeframe.
If buyers remain stronger and OI increases, the trend could continue. If whales show their involvement, this bullish trend can last longer and Pendle price can extend to the $4 mark till the end of 2026.
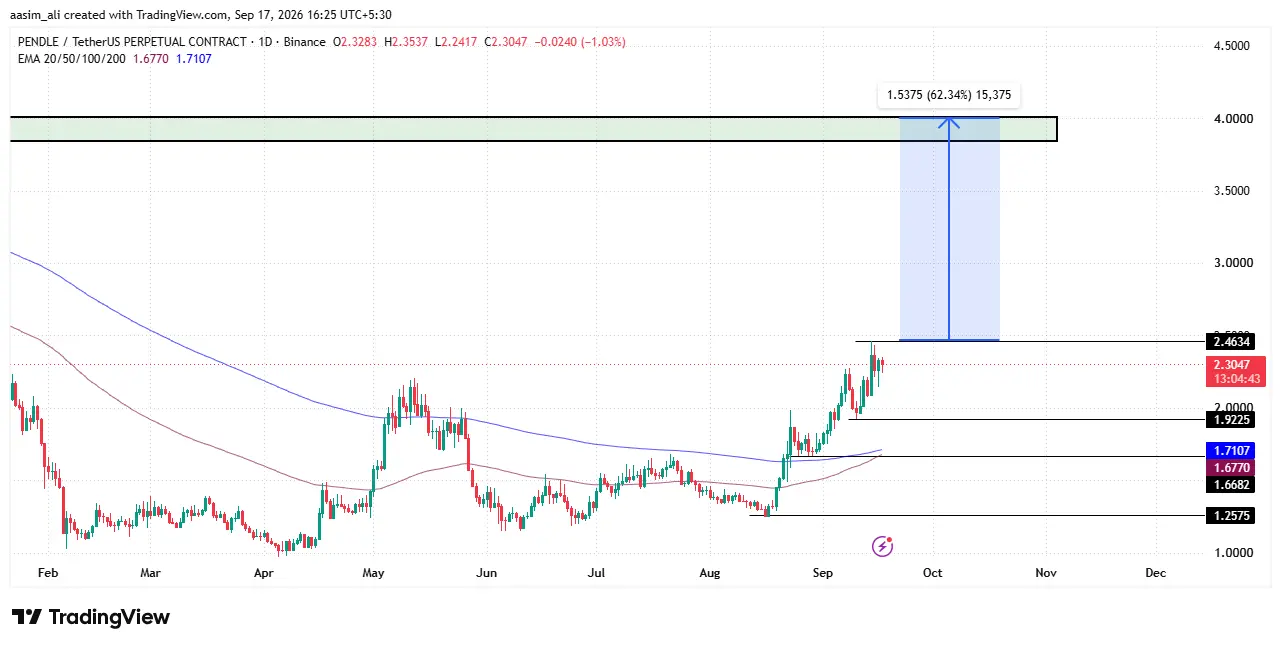
On the other hand, if Pendle price slips below the immediate support level of $1.92 then profit booking can be observed. Once the price sustains below this level, Longs could panic which may lead to a strong selling pressure.
Pendle Price and Volume Analysis
The PENDLE chart shows a bullish structure building since mid-August. Price climbed from around $1.25 to over $2.46, with the strongest push coming after two massive volume spikes on August 21 ($139M) and August 23 ($160M), classic accumulation signals where big buyers stepped in before the price rally that followed.
After that initial surge, PENDLE price consolidated between $1.67-$1.82 through late August into early September, letting volume cool off while price held its gains, a healthy pattern rather than a reversal. From September 6 onward, volume picked up again (consistently above $60M) alongside a steady price climb, culminating in a fresh push toward $2.30-$2.46 by mid-September.
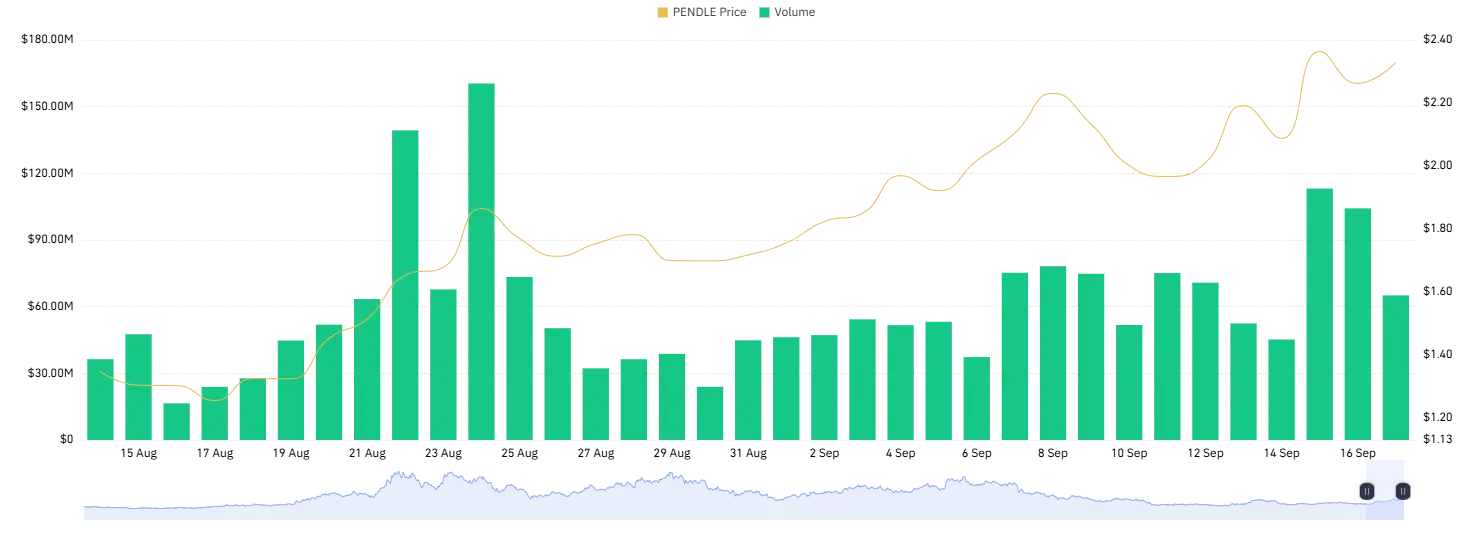
The takeaway: rising price supported by rising volume signals genuine buying interest, not just short-term speculation. If this volume trend holds, PENDLE price could attempt to break past $2.40 resistance in the near term, though a pullback to retest $2.00 support wouldn’t be unusual before the next leg up.
Pendle Price, OI and Funding Rate Analysis
PENDLE/USDT has rallied from a low of $1.92 to a high of $2.46 over the past week, currently trading near $2.32. The move higher was accompanied by a steady rise in aggregate open interest, climbing from roughly 40M to a peak above 50M as price topped out around September 15, a sign fresh leveraged positions were fueling the breakout rather than short covering alone.
Funding rates stayed predominantly positive throughout the rally, occasionally spiking near 0.0075–0.01%, reflecting persistent long-side bias among traders. Two brief dips into negative funding (around September 11–12 and September 17) coincided with short-term pullbacks, suggesting these were healthy resets rather than trend reversals.
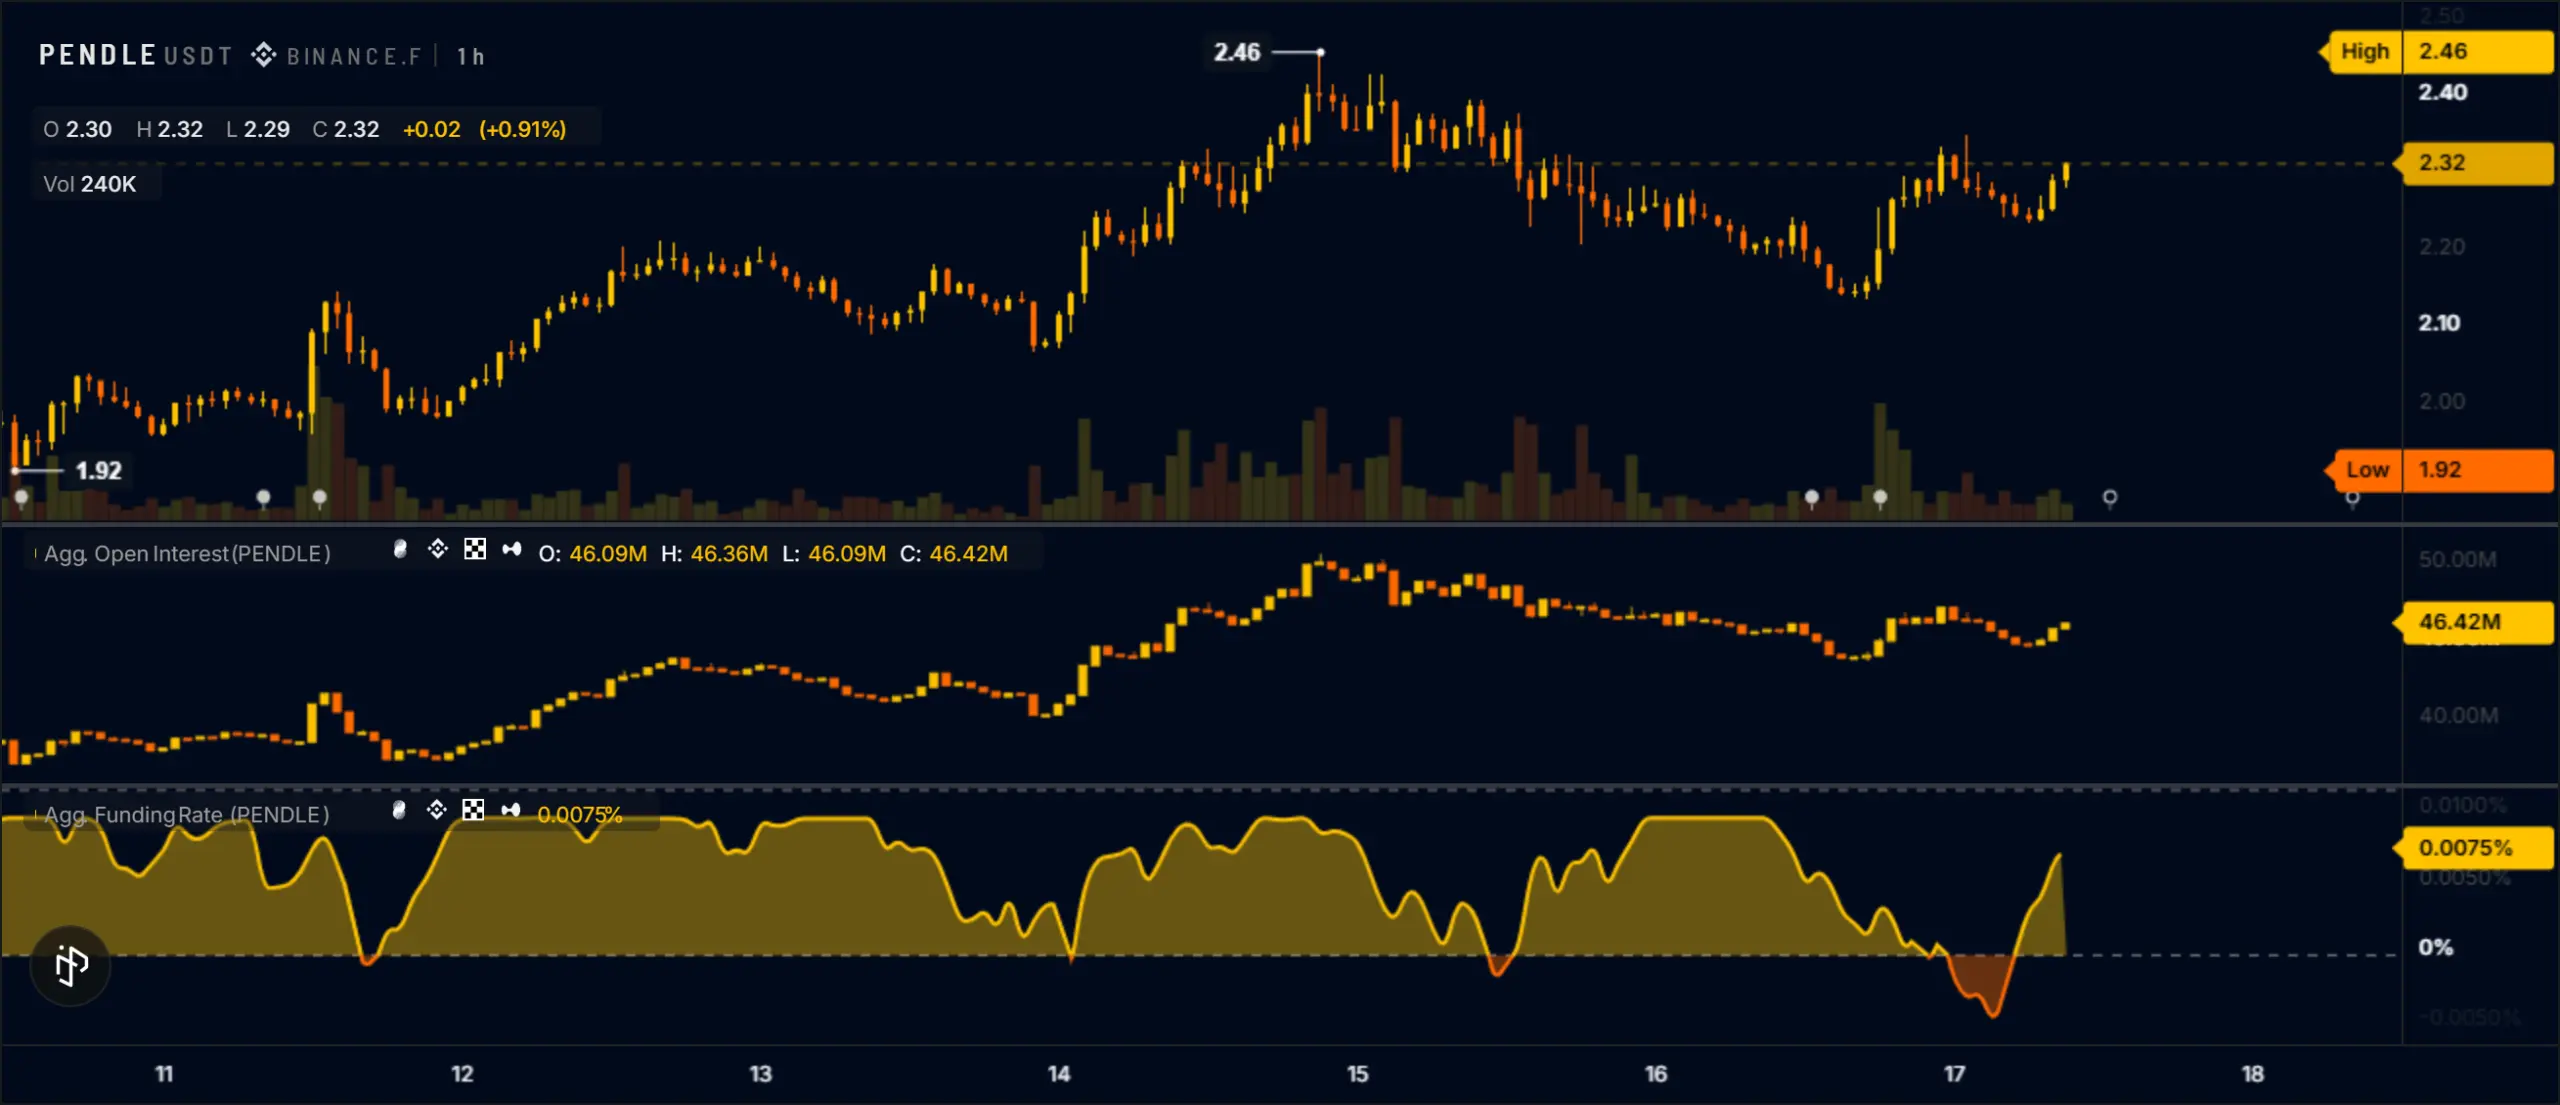
With OI holding near 46M and funding flipping positive again after the latest dip, PENDLE looks poised for another attempt at the $2.40–$2.46 resistance zone, provided open interest continues expanding alongside price rather than diverging from it.
Final Thoughts
Pendle’s price action reflects a market still firmly in “buy the dip” mode. The combination of rising open interest, a return to positive funding, and volume that’s expanding alongside price, rather than diverging from it, points to genuine conviction behind the move, not just leveraged speculation chasing a pump.
The path to $4 isn’t unreasonable if this structure holds: PENDLE needs to first clear the $2.40–$2.46 resistance zone with continued OI growth, then build a fresh base before attempting higher levels. Whale participation and sustained buyer strength will be the key catalysts to watch in the coming weeks.
However, the $1.92 support remains the line in the sand. A daily close below it would likely trigger panic among leveraged longs, unwind recent gains quickly, and put the broader bullish thesis on hold. Until then, Pendle’s trend structure favors the bulls, but as with any asset riding a strong leverage-driven rally, a healthy pullback to retest $2.00 wouldn’t be a red flag; it would just be part of the climb.
Can Pendle price reach $4 in 2026?
A move to $4 is possible if PENDLE clears the $2.40–$2.46 resistance zone with continued open interest growth and sustained whale participation. However, this remains conditional on buyers staying stronger than sellers and no breakdown below key support.
What is the key support level for Pendle right now?
The immediate support lies at $1.92. A daily close below this level could trigger panic among leveraged longs, leading to strong selling pressure and potentially pausing the bullish trend.
Why did Pendle’s funding rate turn positive?
Funding flipped from negative to positive as buying momentum returned, reflecting a persistent long-side bias among traders. This, combined with rising open interest, suggests the rally is being driven by fresh leveraged positions rather than short covering alone.