

The Bitcoin price has remained volatile for the past few days and has dropped below a strong support level of $75,000. OI has dropped sharply alongside the price, indicating liquidation occurred at a higher level. It seems Bitcoin has shifted to a bearish trend, and a further fall can be expected. Let’s explore how BTC can react further.
What are the reasons behind Bitcoin’s rapid fall?
Bitcoin fell about 6–7% in 24 hours on 13 November 2026. It dropped below $69,000 and was trading near $68,400, its lowest level since August. Several factors are behind it, and no single trigger has been established.
- Leveraged longs were wiped out
The drop led to about $1.41 billion in crypto derivatives liquidations over 24 hours, with long positions making up 89% of the total. Forced selling by liquidated traders pushed the price down further. The numbers differ slightly between data sources, but all show a heavy long squeeze. - Spot Bitcoin ETF outflows
November 11 was the fifth straight trading session of net withdrawals, bringing the five-session total to about $1.44 billion. Institutional demand has been weakening for several days. - Strong US dollar
The U.S. dollar surged to a peak not seen since April 2025. A strong dollar usually weighs on risk assets like crypto. - Fed rate-hike worries and a tech sell-off
The decline came amid a sell-off in technology stocks and growing concerns about an interest rate hike by the US Federal Reserve. Investors are also watching US producer price data due Friday for more clues on interest rates. One report also links the sell-off to Nvidia-related turmoil, but I only saw that in a headline snippet, so treat it as unconfirmed. - Weak sentiment
The Fear and Greed Index is at 20, which signals extreme fear.
Bitcoin price overview
At press time, Bitcoin was trading at $68,474.00 which has dropped by 7.1% in the past 23 hours. Its market capitalization was $1.377T and the 24-hour trading volume was $37.243B. Its circulating and total supply is 20.111M BTC while the maximum supply is 21M BTC.
Bitcoin price technical analysis over 1-D timeframe
Bitcoin has been in a bearish trend and has dropped by 11.64% in the first 2 weeks of November. Amid this bearish trend, the BTC price has dropped below a major support level of $75,000. Furthermore, the price was approaching another support zone of $67,000.
If the price receives buying pressure in the $67,000 territory then a short term buying momentum can be seen. If the OI and trading volume increases during the bounce back then the Bitcoin price can extend to the immediate resistance level of $72,000.
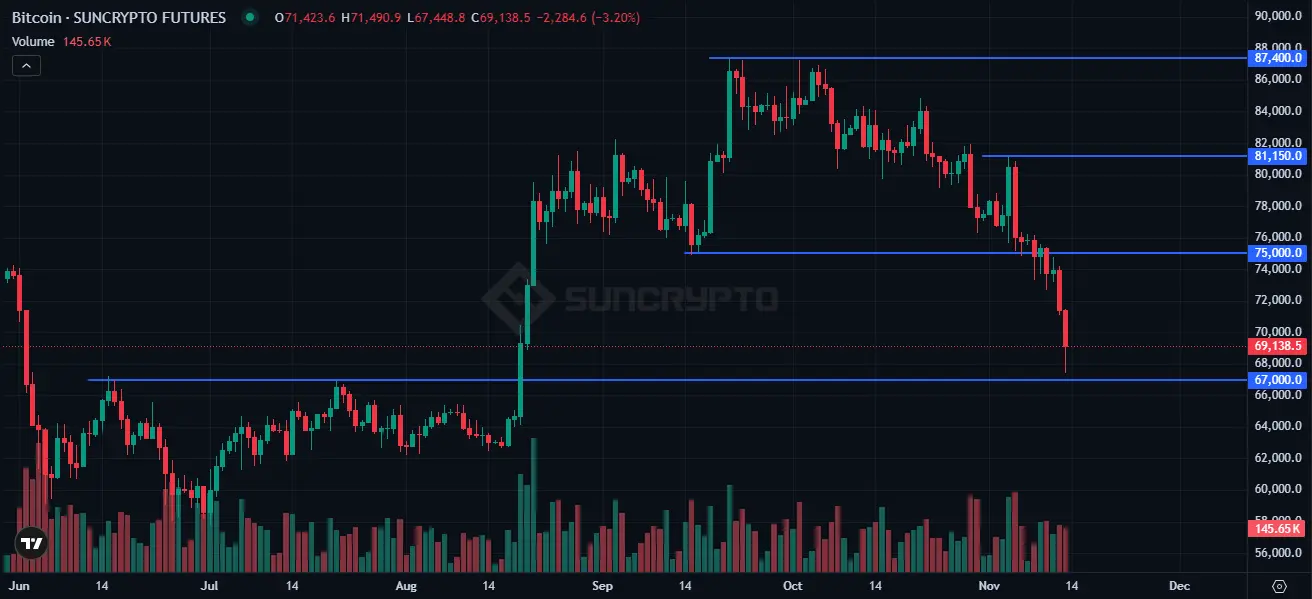
Conversely, if the BTC price fails to defend the zone of $67,000 then it may drop to the immediate support level of $63,000. Once the price slips below this level then it would be difficult for buyers to bounce back.
Bitcoin price analysis based on funding rate and open interest
Bitcoin is trading near $68,900 after a sharp slide from the $74,000 region over the past day. The 15-minute chart shows a steady decline on November 13, followed by a heavy-volume flush that tagged the lows around $68,000 before buyers stepped in. That bounce is early, but it matters.
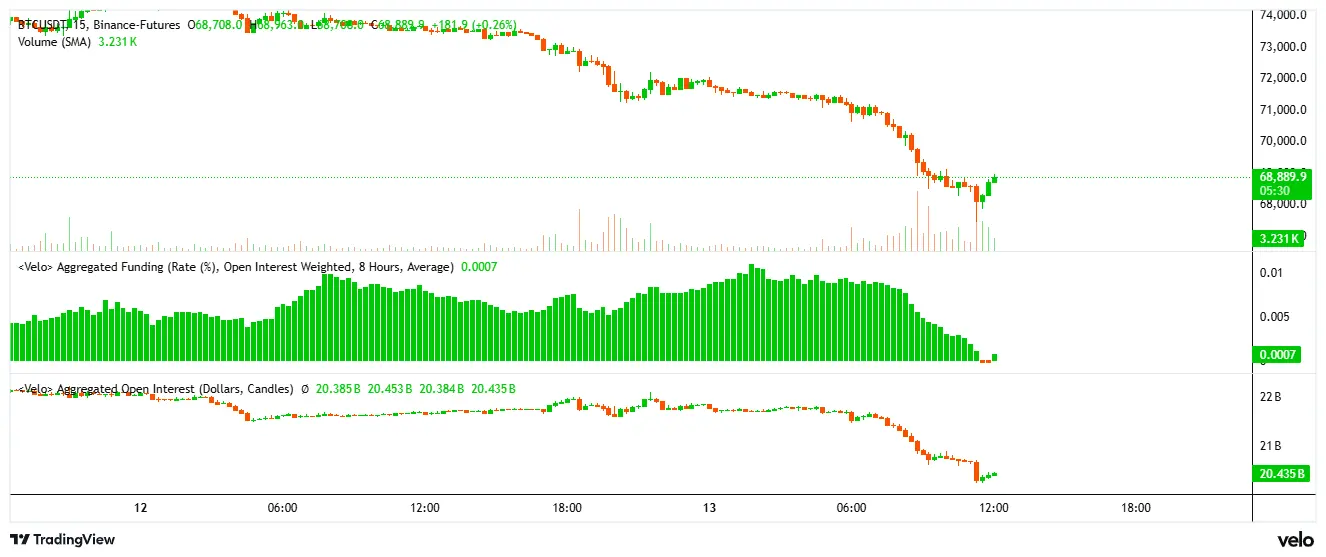
Derivatives data adds context. Aggregated open interest has fallen from roughly $22 billion to about $20.4 billion, which suggests leveraged longs were liquidated rather than new shorts piling in. Funding rates, once elevated near 0.01%, have collapsed to around 0.0007%, so the market is no longer crowded.
This reset often clears the way for a relief move. If BTC holds above $68,000, a rebound toward $70,000-$71,000 is plausible. A clean break below $68,000, however, could open a retest of lower supports. Traders should watch whether open interest rebuilds alongside price, since that would confirm genuine strength.
Final Thoughts
Bitcoin’s drop below $75,000 and its slide toward $68,000 came from several pressures at once: heavy long liquidations, five straight sessions of spot ETF outflows, a strong US dollar, worries about a Fed rate hike, and extreme fear in the market. Open interest fell and funding rates cooled, which suggests the leverage that fueled the fall has largely been flushed out.
In the short term, the $67,000 zone is the level to watch. A bounce from here, backed by rising open interest and volume, could lift BTC toward $70,000-$72,000. If $67,000 breaks, the next support sits near $63,000, where buyers may struggle to regain control.
Over the next few days, traders should keep an eye on US inflation and producer price data, ETF flow trends, and the dollar’s direction. All three could decide whether this is a relief bounce or the start of a deeper correction.
Why is the Bitcoin price falling today?
Bitcoin price fell about 6-7% in 24 hours on 13 November 2026, dropping below $69,000 and slipping under the key $75,000 support. The main drivers are heavy long liquidations (about $1.41 billion), five straight sessions of spot ETF outflows, a strong US dollar, Fed rate-hike worries, and extreme fear in the market.
What is the next support level for Bitcoin?
The immediate support zone is near $67,000. If buyers fail to defend it, Bitcoin price may slide further to $63,000. Below that level, it could become difficult for buyers to stage a recovery.
Will Bitcoin price recover from this fall?
A short-term bounce is possible if Bitcoin price holds above $67,000-$68,000, especially if open interest and trading volume rise along with the price. The first resistance levels to watch are $70,000-$71,000 and then $72,000. Nothing is guaranteed, as crypto prices stay highly volatile.