

Ethereum price has witnessed strong buying pressure for the past few months. Buyers have shown interest after a strong consolidation in a narrow range. ETH price was trading over the key moving averages on a daily timeframe which showcases the bulls’ domination. Trading volume has increased slightly during the recent momentum. Lets connect these dots and see how ETH can perform ahead.
Fundamentals we should know about Ethereum
- Spot ETH ETF flows
Daily net inflows or outflows show whether institutions are buying the dip or selling. They also pair well with your volume section. - Staking data
Total ETH staked, the percentage of supply staked, and the staking yield. A high staked share means less liquid supply, which supports the bullish case. - Exchange reserves and supply
Falling ETH balances on exchanges usually mean holders are moving to self-custody, which reduces selling pressure. You can add net issuance or burn here, since your overview already mentions supply. - Network activity
Daily active addresses, transaction count, and Layer 2 activity. Rising usage backs up a price breakout with real demand. - DeFi TVL and stablecoin supply
ETH’s share of total DeFi TVL and the amount of stablecoins on Ethereum show how much capital is working on the network. - Protocol upgrades
Mention the status of the next planned network upgrade and what it improves (scaling, fees, or throughput). Check the current timeline on the Ethereum Foundation blog or ethereum.org, as upgrade dates often shift. - Macro backdrop
Interest rate expectations, the US dollar, and Bitcoin’s trend, since ETH usually follows BTC and risk assets. Even two lines here help readers who are new to crypto. - Institutional and corporate treasury demand
Public companies holding ETH on their balance sheets are a newer driver worth a short mention. Source: Strategic ETH Reserve, company filings.
Ethereum price overview
At press time, Ethereum was trading at $2,711.48 which remained neutral in an intraday session. Its market capitalization was $330.989B and the 24-hour trading volume was $$8.39B. Its circulating and total supply is 122.108M ETH.
Ethereum price analysis over 1-D timeframe
Ethereum price has been in a bullish trend on a daily timeframe and has surged by more than 70% since July. ETH has followed a pattern of ‘consolidation and breakout’. It has done this twice since July and the price underwent a consolidation phase again.
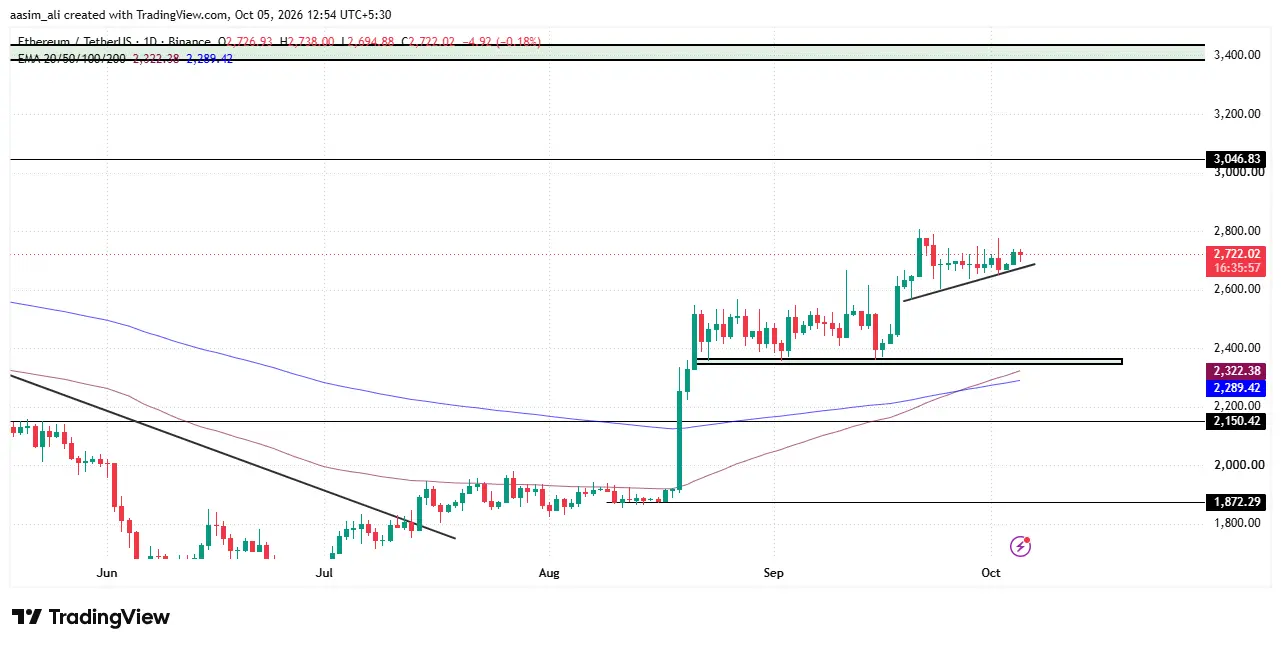
Ethereum price has been defending its previous swing low which showcases the buyers’ dominance. If the price triggers a breakout from the consolidation zone, buyers might show interest. If the trading volume and OI increases at the time of breakout, major buying momentum can be seen and the price could extend to the $3,000 level. If the Ethereum price sustains over the $3,000 level, the rally can extend further.
Conversely, if Ethereum price slips below the ascending trendline and closes beneath, buyers might lose the momentum. If sellers remain stronger, the price could drop to the major support level of $2,360. If buyers fail to defend this level, the price could drop to the next support level of $2,150.
Ethereum price prediction: What September’s volume data tells us?
Ethereum’s price action from 1 September to 5 October shows a market consolidating rather than trending. ETH started September near $2,470, dipped toward $2,370, and then climbed steadily. The biggest move came around 22 September, when daily volume spiked to roughly $80B and price jumped to nearly $2,807, the month’s high.
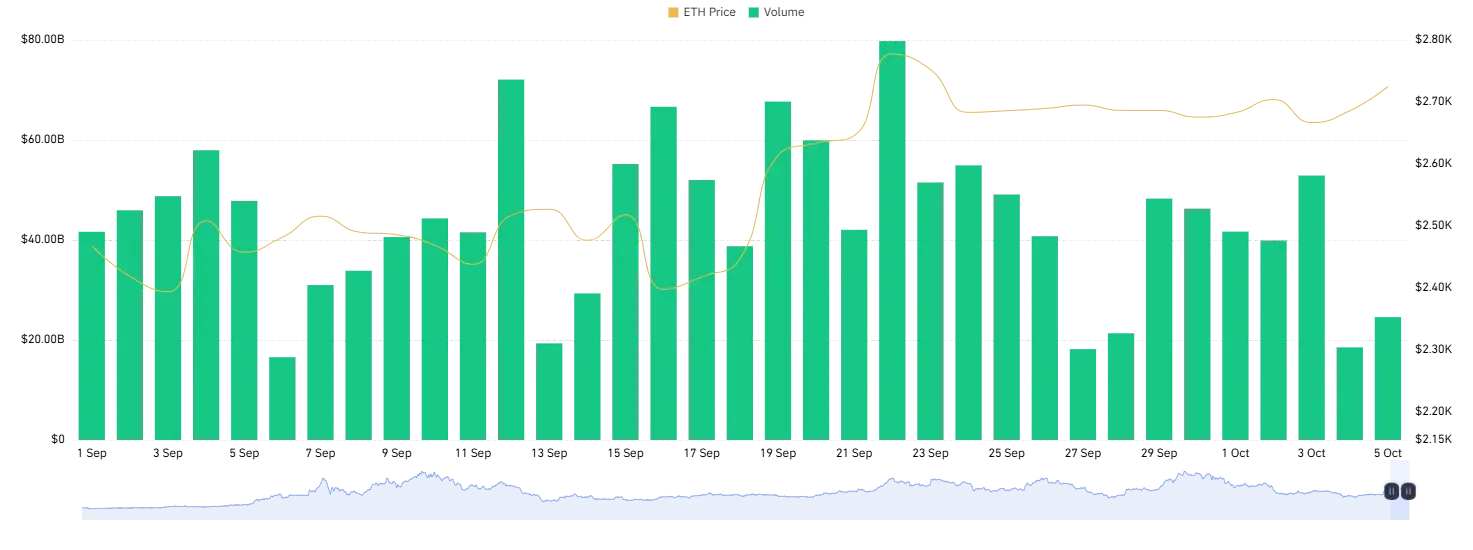
Since then, ETH has held a tight range of $2,660-$2,710 despite volume dropping to $18–$25B on recent days. This suggests the post-rally selling pressure is fading. On 5 October, price was edging back up toward $2,720.
Outlook: If volume returns above $50B with a close over $2,780, ETH could target the $2,900-$3,000 zones. If it loses the $2,650 support, a retest of $2,500 is possible. For now, the bias is cautiously bullish, but a volume-backed breakout is needed for confirmation.
Ethereum price outlook
Ethereum is trading near $2,712, and the derivatives data offers some useful clues about where it may head next.
On October 2, ETH touched roughly $2,780 before a sharp leverage flush pushed it down to around $2,655. Funding turned negative during that drop, showing traders had piled into shorts. Since then, ETH has formed higher lows, a sign that buyers are stepping in on dips.
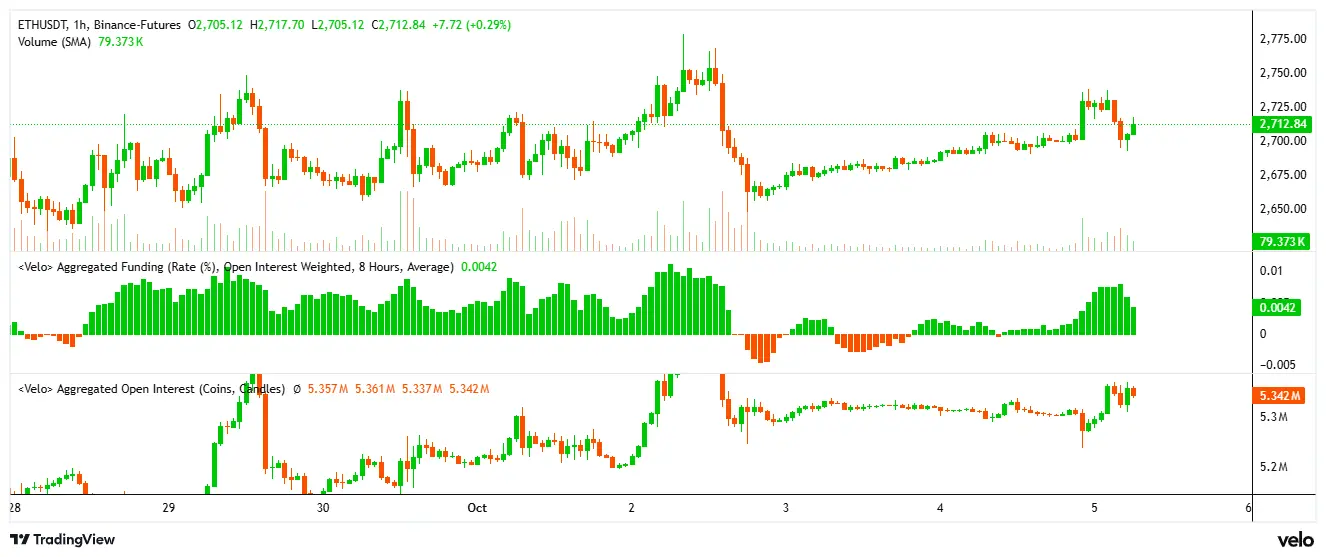
Funding is now positive again at 0.0042%. That points to bullish positioning, but it is far from the extreme levels that usually signal an overheated market. Open interest is stable around 5.3 million ETH, so there is no sign of a large new leveraged build-up.
A daily close above $2,780, backed by rising volume and open interest, could open the door to further upside. A break below support may bring another dip. For now, the bias is neutral to bullish, with a breakout still pending.
Key levels: resistance sits at $2,740 to $2,780, and support at $2,650 to $2,690.
Final Thoughts
Ethereum has spent the past few months in a clear pattern of consolidation followed by breakout, and it is now sitting in another tight range near $2,712. The broader structure still favors the bulls: price holds above key moving averages, higher lows keep forming after the October 2 leverage flush, and funding has turned positive without reaching overheated levels. Open interest is steady at around 5.3 million ETH, so the market isn’t over-leveraged.
What’s missing is confirmation. Volume has cooled to the $18-25B range compared with the roughly $80B spike seen on 22 September, which means buyers haven’t yet committed to a decisive move.
Bullish case: A daily close above $2,780, backed by rising volume (ideally above $50B) and open interest, could open the way to $2,900 and then the $3,000 zone. Holding above $3,000 would strengthen the case for a longer rally.
Bearish case: A loss of the $2,650 support, or a close below the ascending trendline, could drag ETH toward $2,500, with deeper support at $2,360 and $2,150.
What are the key support and resistance levels for ETH?
Resistance sits at $2,740 to $2,780, and support at $2,650 to $2,690. If Ethereum price breaks below support, the next levels to watch are $2,500, then the major supports at $2,360 and $2,150.
Can Ethereum price reach $3,000?
Yes, it is possible, but it needs confirmation first. A daily close above $2,780, backed by rising volume (ideally above $50B) and higher open interest, could open the way to $2,900 and then $3,000. Holding above $3,000 would strengthen the case for a longer rally.
What do funding rates and open interest say about ETH right now?
Funding is positive at 0.0042%, which points to mildly bullish positioning without being overheated. Open interest is steady at around 5.3 million ETH, so there is no sign of a large new leveraged build-up. This follows the October 2 leverage flush, after which ETH has been forming higher lows.