
eCash price has experienced strong selling pressure on wider timeframes. However, buyers have bounced back and continuously pushed the price. XEC price has formed a bullish candlestick pattern on a weekly timeframe. The price has surpassed the 100-days EMA which showcases buyers’ interest.
eCash (XEC) price overview
XEC price was trading at $0.0000069 at press time with an intraday loss of 3.6%. It has a market capitalization of $140.803M and the 24-hour trading volume is $4.045M. Its circulating and total supply is 20.075T XEC while the maximum supply is 21T.
XEC price technical analysis
eCash price has been in a bearish trend on a daily timeframe. However, the chart structure suggests that buyers are showing interest. The price has managed to defend a psychological level of $0.00000500. XEC price has surged by more than 40% since July and has exceeded the 100-days EMA on a daily timeframe.
XEC price reached the 200-days EMA amid this bullish trend but failed to exceed and sellers pulled the price. Currently, the eCash price is trading between the 100-days and 200-days EMA.
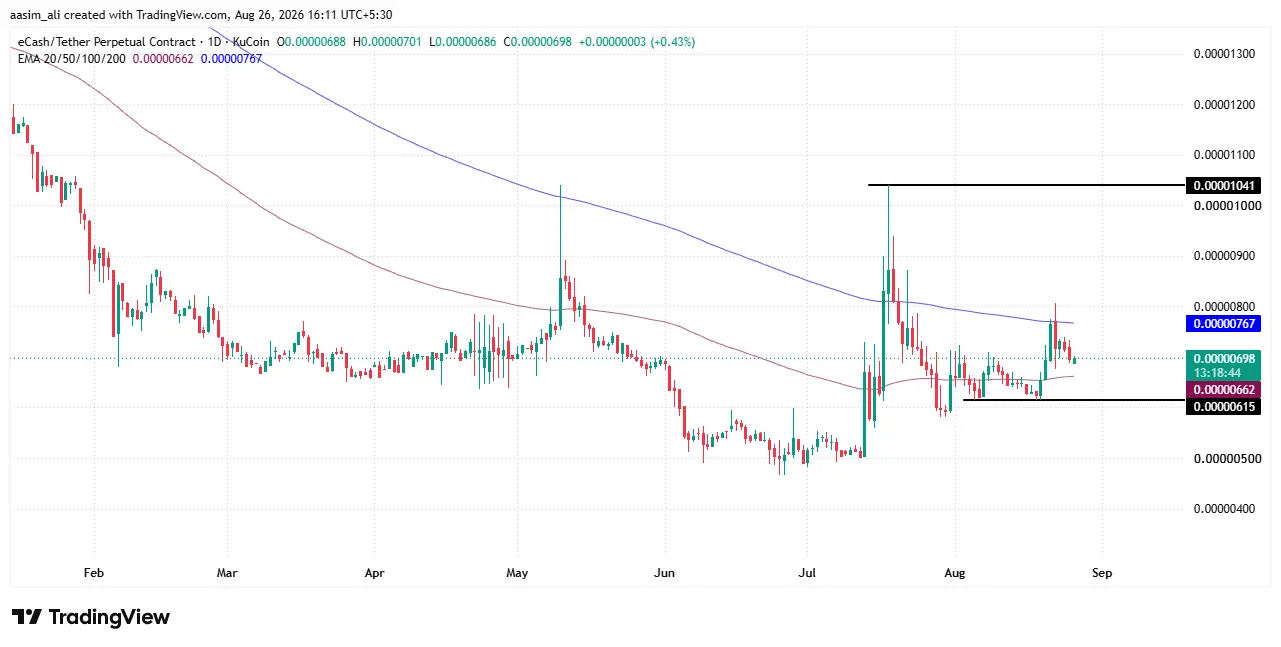
If the price rises and triggers a breakout from 200-days EMA, buyers might dominate further. Once the price sustains over the 200-days EMA, buyers may push the price to the previous high of $0.00001040.
Alternatively, if the eCash price slips below the 100-days EMA then sellers could become stronger again. Losing this EMA can be a bearish signal which could lead to a bearish trend. Once the price starts trading below the immediate support level of $0.00000615, it could be difficult for buyers to bounce back.
eCash price forming bullish pattern on weekly timeframe: What’s next?
It seems like XEC coin price has found the bottom near the $.00000500 according to the chart behavior on a weekly timeframe. eCash chart structure is forming an inverted head and shoulder pattern after a strong bearish trend. This is a bullish candlestick pattern which might attract buyers.
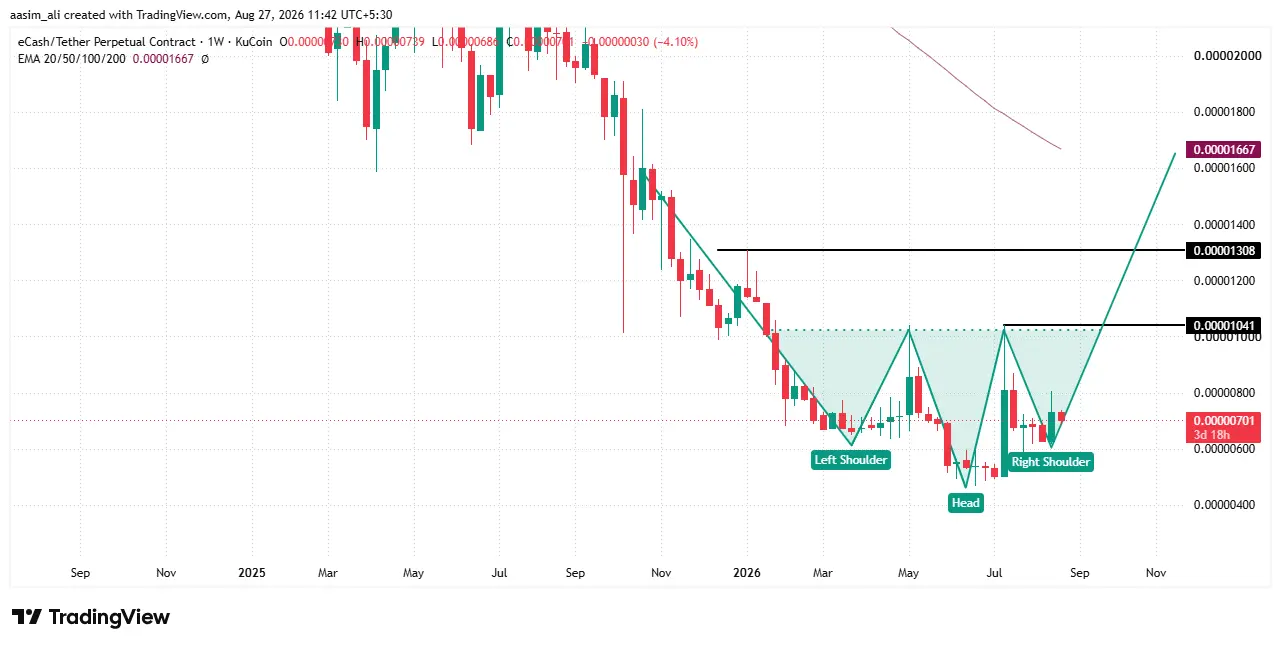
The chart structure is forming a ‘right shoulder’ which could be a bullish move. If buyers manage to form ‘right shoulder’ then a strong bullish trend can be seen. Amid this bullish trend, the price can extend to the $0.0000150 level till 2027. If buyers fail to form the ‘right shoulder’ then sellers could dominate further and may lead the bearish trend further.
What can XEC be used for?
The eCash network follows both the Bitcoin whitepaper and the Avalanche whitepaper (not to be confused with AVAX) and is focused primarily on being a trustless, permissionless, and scalable digital cash network that works with instant transaction finality. It is programmable money anyone can facilitate transactions with in its native XEC currency, but also in the form of any kind of tokenized asset like stablecoins or NFTs.
What makes eCash unique?
The eCash (XEC) network is the only network that has integrated the Avalanche protocol with its core Nakamoto consensus, which also differentiates itself from the usual PoW/PoS Masternode solutions. Avalanche can come to consensus in about 2 seconds as opposed to Nakamoto’s characteristic 10-minute block times, enabling nodes to communicate in real-time to make decisions in a more granular fashion. The network retains the trustless and decentralized nature of Bitcoin’s PoW consensus while gaining more flexibility, security, and speed through the Avalanche protocol.
Another advantage of eCash’s Avalanche integration is its permissionless subnet capability. Subnets with arbitrary protocol changes can be created while staying pegged to the main chain. The development team plans to create an Ethereum Virtual Machine (EVM)-subnet to be interoperable with the decentralized finance (DeFi) sector as well as a Zero-Knowledge (ZK)-subnet for an additional layer of privacy.
The network also provides eTokens, a colored-coins implementation based on the Simple Ledger Protocol. This eToken protocol allows for a simple and cost-efficient handling of fungible tokens and NFTs. Tokens can be created and traded directly within the Cashtab reference wallet. The capability to handle gas-less transactions as seen with TixTown’s CRD token, makes this particularly useful for stablecoins and other use cases where the user can pay transaction fees in the token itself, rather than the native coin.
The eCash engineers follow a unique roadmap that was proposed as early as 2017. The vision was to scale Bitcoin-technology to global scale and make it a public, instant, low fee, high capacity network. A network that would outmatch legacy finance and looming CBDC implementations in scalability, time to finality, and protocol security.
Final thought
eCash’s short-term trend hinges on a single technical level, the 200-day EMA. A confirmed breakout above it, backed by the weekly inverted head-and-shoulders setup, could open the path toward the $0.0000104 high and potentially $0.000015 over a longer horizon. But if buyers fail to hold the 100-day EMA and the $0.00000615 support, the bullish structure breaks down and sellers likely regain control. In short, XEC is at a decision point: the pattern is bullish, but it’s unconfirmed, and the next few weekly candles will likely determine which way it resolves.
Is eCash price trend turning bullish?
XEC is showing early bullish signals, it has surpassed the 100-day EMA and formed a bullish candlestick pattern on the weekly chart. However, the trend hasn’t fully flipped yet; it needs to break above the 200-day EMA to confirm a stronger bullish move.
What price level could XEC reach if the bullish trend continues?
If buyers sustain momentum above the 200-day EMA, XEC could target its previous high of $0.0000104. In an extended bullish scenario, backed by the weekly inverted head-and-shoulders pattern, the price could stretch toward $0.000015 by 2027.
What could invalidate the bullish setup for XEC?
If XEC slips below the 100-day EMA and the $0.00000615 support level, sellers could regain control, making it difficult for buyers to bounce back and potentially resuming the bearish trend.