

Dash price has experienced massive selling pressure and has surged by around 75% in a week. The price has reached the $70 territory and has displayed mild price rejection due to the profit booking. Amid this bullish trend, OI and trading volume have increased dramatically. Let’s connect these dots and analyze the outcome for DASH price prediction.
Dash (DASH) price overview
The dash price was trading at $67.88 at press time with an intraday gain of 29.92%. Its market capitalization was $870.425M with the 24-hour trading volume of $582.432M. It has a circulating and total supply of 12.827M DASH, while the maximum supply is 18.92M DASH.
DASH price analysis over 1-D timeframe
Dash price has displayed bulls’ dominance for the past few days and has lifted the price to the $70 territory. The price has surged by around 50% in the first 5 days of September. This momentum was supported by trading volume and OI data too, which suggests that this is not just a pump but could be a trend. Dash coin could continue the trend if these data remain strong.
According to the chart structure, the price was heading toward the next resistance level of $96.40. If bulls remain stronger, the price could extend to this resistance level. Here, few investors and traders might prefer to book profit, which may lead to a mild fall.
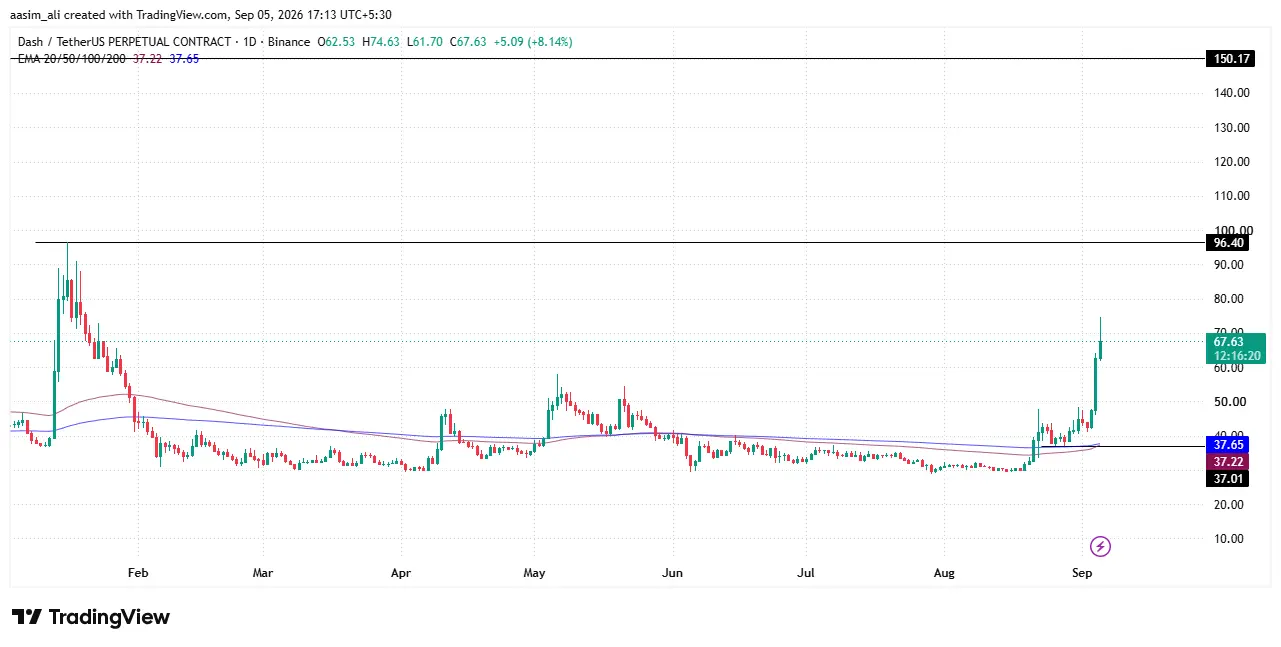
Once the price manages to hold over this level, buyers might be confident, and the price could reclaim the $150 mark by the end of 2026. Conversely, if the DASH crypto price faces resistance from the $95.4 level, then sellers may bounce back.
Aggressive selling pressure can pull the price to the next support level of $63.5. This level was tested multiple times on a monthly timeframe in 2020 by DASH price. Furthermore, if the price loses this level, then it may melt to the $37.
DASH price and Open Interest (OI) data analysis
The chart shows a strong positive correlation between DASH’s price and Open Interest (OI), especially in the most recent leg of the rally. Each major price surge: Aug 21-23, Aug 31-Sep 2, and most dramatically Sep 3-5, was accompanied by a sharp rise in OI, indicating fresh capital and new leveraged positions entering the market rather than short covering alone. The near-vertical spike in both metrics into Sep 5, with OI hitting an all-time high ($113M) alongside the price top, signals aggressive bullish positioning and rising speculative interest.
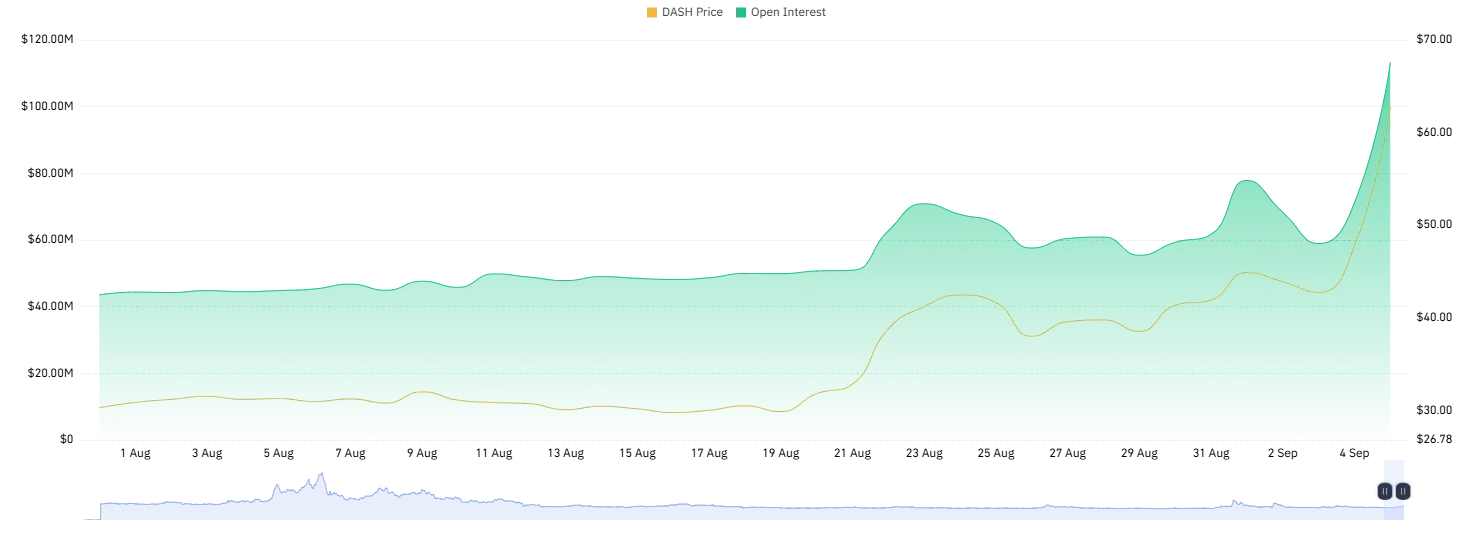
However, such steep, synchronized spikes often precede short-term volatility. When OI rises this fast alongside price, it typically means high leverage in the system, making the market vulnerable to a long squeeze or sharp correction if profit-booking or negative news triggers liquidations. Traders should watch whether OI stays elevated (bullish continuation) or drops sharply after the price peak (correction signal).
Dash price and volume analysis
Dash (DASH) has staged a sharp rally, climbing from roughly $30 on 3 August to over $70 by 5 September, more than doubling in five weeks. The move has been accompanied by a clear volume expansion: daily trading volume stayed subdued below $50M through mid-August, then surged past $500M on 23 August and again hit a fresh high near $780M on 4-5 September, coinciding with the steepest leg of the price rise. This pattern of rising price validated by rising volume is technically bullish, suggesting genuine buying conviction rather than a low-liquidity spike.
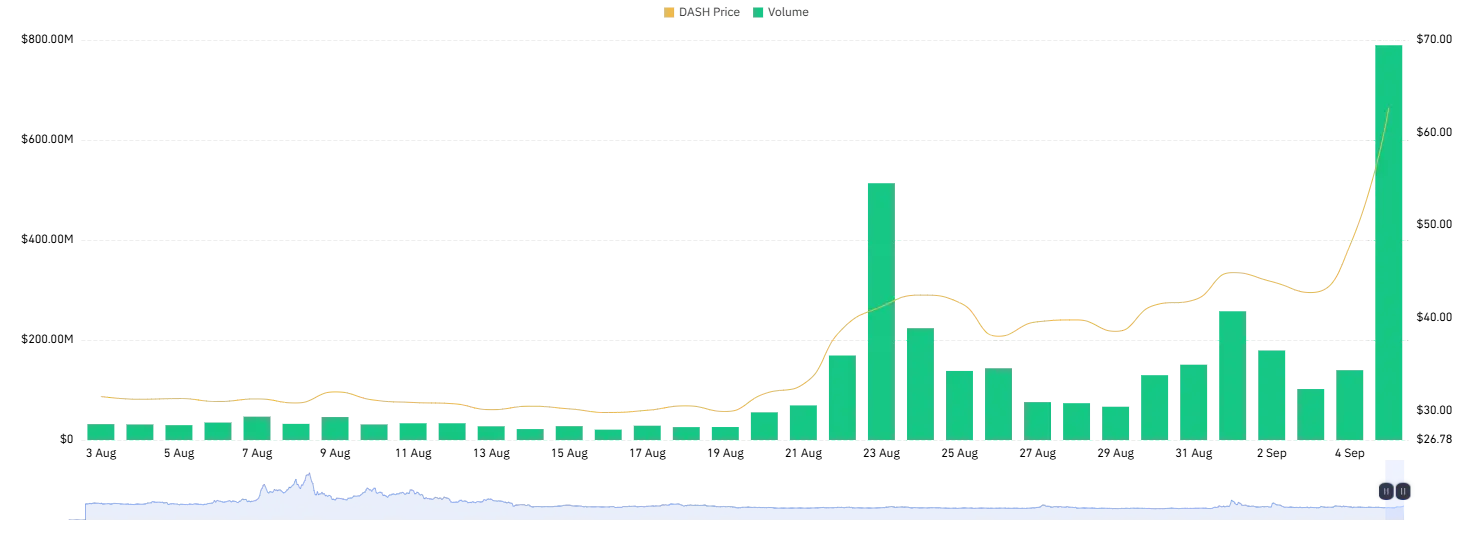
If volume sustains above its recent average while price holds above the $55-60 zone, DASH could target further upside toward $80 – $84. However, such a rapid volume-fueled rally also raises overbought risk; a volume drop-off without a price pullback would be an early warning of exhaustion, while a volume-backed dip could offer a healthier re-entry point.
Final Thoughts
Dash’s 75% weekly surge is backed by more than just hype; rising volume and record OI suggest fresh capital is genuinely flowing into the trade, not just short covering. That said, the speed of this rally is a double-edged sword: the same leverage build-up that’s fueling the upside could just as easily trigger a sharp long squeeze if sentiment turns.
The $95.4–$96.40 zone is the level to watch. A decisive close above it, backed by sustained OI and volume, would open the door for DASH to work toward the $150 target by end-2026. But if bulls fail to clear this resistance and profit-booking intensifies, a retracement toward the $55–$60 support (and in a deeper correction, $37.66) looks more likely.
Why did Dash price surge 75% in a week?
The rally was driven by a sharp rise in trading volume and open interest, indicating fresh capital and new leveraged positions entering the market rather than just short covering. This suggests genuine buying conviction behind the move rather than a low-liquidity spike.
Can Dash price reach $150 in 2026?
Yes, but it depends on DASH clearing the $95.4–$96.40 resistance zone first. If bulls hold above this level with sustained volume and OI support, the price could work toward $150 by the end of 2026. A rejection at this zone, however, could delay or invalidate this target.
What is the next resistance and support level for DASH?
The immediate resistance lies at $96.40, while the key support level is at $37.66. In the near term, DASH could also see intermediate moves toward the $80–$84 zone if volume stays strong.